Azure Kubernetes Service (AKS) – eBPF-based networking & security + integration with Microsoft Sentinel
Unlocking Next-Gen Kubernetes Security with eBPF tooling and Microsoft Sentinel
This post explores the setup and configuration of Cilium and Tetragon in Azure Kubernetes Service and integrating & monitoring with Microsoft Sentinel.
Essentially, it does what this blog from Isovalent talks about, but with some cool security features, and not behind a premium service.
For some reason, that blog includes a screenshot from Elastic, rather than Microsoft Sentinel 🙃
By combining Cilium (eBPF networking), Tetragon (runtime security), and Microsoft Sentinel (SIEM), you get deep visibility into Kubernetes traffic, real-time security enforcement, and SOC-ready alerting—all without paying for premium enterprise licenses.
This demonstation (and supporting IaC) goes like this: Cilium is installed in an AKS cluster, with kube-proxy replaced with Cilium’s eBPF-based alternative and envoy installed for Layer 7 inspection. Hubble is available to enable deep insight into the networking within your cluster. Tetragon is installed, with example policies for monitoring “sensitive” files in a “production” workload (AKS Pet Store demo app). Logs are streamed to Microsoft Sentinel in real-time, with an accompanying analytics rule, which creates an incident when the container has been “breached”.
A video demonstration is available here, and all the terraform code is available on my github. Unfortunately, deployment takes about 30 minutes (you’ll see why if you read on 👀). I’ve intentionally written verbose terraform, so you can easily pick parts out for your own deployments and can deploy easily without a bunch of bespoke tooling.
I’m not going to talk about eBPF in detail; I’ll likely cover that in a complementary talk or blog in the future. It’s also not meant to be a deep dive into Cilium or Tetragon, or Microsoft Sentinel; but rather a light touch on all of them together.
The point of this exercise, is to highlight some of these exciting technologies, and integrate them together to provide a powerful capability. It’s pretty painful getting this working, so I’m hoping I’ll save others from the same fate, as you can now just use my working examples 🔥.
If you want to learn a bit about how to set this up, then read on. Otherwise i’d recommend checking out the video demonstration to see this bad boy in action.
Sexy Security Stuff
The headlines are this:
- Cilium is outrageously good
- I can replace kube-proxy (iptables-based) with a sexy eBPF-based alternative, significantly improving performance
- L7 inspection with envoy - meaning I can check HTTP traffic within my cluster using eBPF 🔥
- It’s even got native wireguard/ipsec termination 👀
- Complete observability out the box; easy integration with managed services such as promethues (metrics) and grafana
- Tetragon - I feel like this deserves more hype. With negligible performance overhead and simple management, I can:
- Block specific syscalls
- Block network calls
- Monitor for sensitive file read/writes
- I can integrate all this with Microsoft Sentinel and build a SOC on steroids. We all know SIEMs need data - with this blog I’ll give you more data than you ever need.
It blows my mind, that with open-source technology and a laptop, I can build a cluster on steroids with decent observability, and configure a SIEM with super rich and useful information/context. The Azure resources are also pretty cheap (at a small scale).
Introduction
There are an awful lot of components to this deployment; too many to go into each in detail. But I do feel the need to gently introduce CNI.
Feel free to deploy the code and have a play yourself! I’m fully aware that its not a good way of deploying infrastructure, or even writing terraform. It’s intentionally easy to read and reverse engineer, so you wont have to go through the pain of figuring this stuff out.
Container Network Interface (CNI)
A CNI (Container Network Interface) is a plugin-based framework that lets you configure networking for your clusters containers. It defines how your pods get IPs, talk to each other, and connect to outside networks. The CNI handles all the low-level stuff like assigning IPs, setting up routing, and enforcing network policies.
By default, cloud platforms like Azure provide their own CNI (Azure CNI), but “Bring Your Own CNI” (BYOCNI) lets you swap it out for something like Cilium, Calico, or Flannel. This can lead to better performance and advanced security features but it means you’ve gotta manage it yourself.
Azure CNI Powered by Cilium
There is also “Azure CNI Powered by Cilium” (catchy name) which sounds like a great way to get the benefits of Cilium, without the pain of setting it up or managing it.
But you should know that “Azure CNI Powered by Cilium” has a very limited capability. Pretty much all of the cool and powerful security features are not available, unless you pay for the enterprise version.
| Azure CNI Powered by Cilium | Isovalent Enterprise for Cilium | |
|---|---|---|
| Cilium | ✔ | ❌ |
| Network Routing (CNI) | ✔ | ❌ |
| Identity-based Network Policy (Labels, CIDR) | ✔ | ❌ |
| Load-Balancing (L3/L4) | ❌ | ✔ |
| Advanced Networking (BGP, Multi-Homing, SRv6, Bandwidth Management, …) | ❌ | ✔ |
| Advanced Network Policy (DNS, L7, TLS/SNI, …) | ❌ | ✔ |
| Cluster Mesh (Routing, Load-Balancing, Service Discovery, Policy, Overlapping PodCIDR Support) | ❌ | ✔ |
| Transparent Encryption (Wireguard & IPsec) | ❌ | ✔ |
| Multicast | ❌ | ✔ |
| Egress Gateway | ❌ | ✔ |
| Egress Gateway High Availability | ❌ | ✔ |
| DNS Proxy | ❌ | ✔ |
| DNS Proxy High Availability | ❌ | ✔ |
| Ingress & Gateway API Support | ❌ | ✔ |
| Encapsulation Support (VXLAN & GENEVE) | ❌ | ✔ |
| Cilium Service Mesh | ||
| Service Mesh (eBPF & Envoy, sidecar-free) | ❌ | ✔ |
| Canary Rollouts, Retries, Rate Limiting | ❌ | ✔ |
| L7 Load-Balancing | ❌ | ✔ |
| OpenTelemetry, Prometheus, Grafana Support | ❌ | ✔ |
| Hubble - (Network Observability) | ||
| Hubble Network Observability (TCP, UDP, SCTP, DNS, HTTP, gRPC, TLS, …) | ❌ | ✔ |
| Prometheus, Grafana, OpenTelemetry, Fluentd export | ❌ | ✔ |
| Service & Tracing Map | ❌ | ✔ |
| SIEM Integration | ❌ | ✔ |
| Timescape - Historic Flow/Tracing Data & Analytics | ❌ | ✔ |
| RBAC | ❌ | ✔ |
| Tetragon | ||
| Security Observability (Process, Syscall, File, Network, …) | ❌ | ✔ |
| File Integrity Monitoring (FIM) | ❌ | ✔ |
| Combined Network & Runtime Visibility | ❌ | ✔ |
| Real-Time Enforcement | ❌ | ✔ |
| SIEM Integration | ❌ | ✔ |
| Timescape - Historic Security Visibility & Analytics | ❌ | ✔ |
One of the other biggies for me, was the fact that Hubble isnt supported!. Surely hubble is pretty core to unlocking the observability benefits that Cilium provides 🤔.
If you couple that with some of the limitations set out in the Azure documentation:
- Available only for Linux and not for Windows.
- Cilium L7 policy enforcement is disabled
I really question why anyone would bother with Azure CNI Powered by Cilium. It is fiddely to set this up manually, but this blog and acompanying code will walk through it, and provide pretty much all of that “premium” functionality.
Deployment
So we need to deploy an AKS cluster in Bring your Own CNI mode, and install Cilium ourselves via helm - that should be ezpz. But there are a few gotchas to make you aware of.
For AKS at least, by default your Cilium (+ hubble) installation wont install on any system nodes, as it’s not a critical resource. You’ll also need to make sure you have more than one node, or Cilium will show one of the operators in a pending state. In this demo code, I’ve opted for two system nodes amd two user nodes and I’ve forced the installation of Cilium and Tetragon onto the system nodes (check out the flags on the helm install terraform).
Also, by default, AKS will deploy the kube-proxy Daemonset, and you can’t deploy AKS without it. It’s a separate operation to disable and then replace the kube-proxy. Additionally, replacing the kube-proxy isn’t possible until you register the KubeProxyConfigurationPreview feature on the subscription.
To do that you need to firstly enable aks-preview extension in your subscription:
1
az extension add --name aks-preview
and register the KubeProxyConfigurationPreview feature.
1
2
az feature register --namespace "Microsoft.ContainerService" --name "KubeProxyConfigurationPreview"
az provider register --namespace Microsoft.ContainerService
Then you can use the following JSON and update the cluster: az aks update -g myResourceGroup -n myAKSCluster --kube-proxy-config kube-proxy.json
1
2
3
4
5
6
7
8
9
10
{
  "enabled": false,
  "mode": "IPVS",
  "ipvsConfig": {
    "scheduler": "LeastConnection",
    "TCPTimeoutSeconds": 900,
    "TCPFINTimeoutSeconds": 120,
    "UDPTimeoutSeconds": 300
  }
}
Don’t worry, all of this (except feature registration) is baked into my
hackydelightful terraform
Once kube-proxy is disabled, we can finally install Cilium via helm, with the kubeProxyReplacement flag set to true.
What’s not immediately obvious, but makes sense when you understand it, is that replacing the kube-proxy is an important prerequisite in order to get the most out of Cilium. Replacing it enables performance benefits, and also Layer 7 aware traffic management. For example, we could inspect incoming HTTP headers on ingress and use it as a trivial WAF (thats another blog, I already have the PoC if anyone is interested 😉). Envoy in Cilium starts as a proxy, where all L7 traffic (policies/ingress) is forwarded too.
For complete L7 capability, you’ll need to set the following flags in the Cilium helm chart installation:
1
2
3
4
5
6
envoy.enabled = true
ingressController.enabled
ingressController.loadbalancerMode="dedicated"
ingressController.default
envoyConfig.enabled
loadBalancer.l7.backend="envoy"
That’ll include L7 traffic management and ingress. This works completely in the provided code, but I dont show it off in the video.
By default, Hubble will redact sensitive information in Layer 7 traffic. You can set the
hubble.redact.enabledflag in the Cilium helm chart to disable this functionality.
By default, Cilium operates in an “allow-all” mode, meaning all traffic is permitted and nothing is logged. Once a policy is applied, that mode changes and you can configure Cilium to start capturing traffic logs.
Cilium Cli
You can optionally install the Cilium CLI to help debug and manage the Cilium deployment.
Ensure you’ve updated your kubeconfig with your AKS cluster:
1
az aks get-credentials --name akingscote-production --resource-group akingscote-production-rg --overwrite-existing
Run cilium status to check that everything is installed as expected.
You should see the following: 
There is a
cilium connectivity testbut i dont recommend running it - its pretty slow to complete.
Tetragon
Tetragon is an open-source runtime security tool that uses eBPF to monitor and protect Kubernetes workloads at the kernel level via eBPF. This means it’s got deep visibility into things like process execution, file access, and network activity—without needing to modify your apps and with minimal performance implications.
What really stands out to me are its real-world use cases: catching container escapes (when a process breaks out of its sandbox), spotting malicious process injections, detecting weak TLS ciphers, and even detecting ransomware by monitoring sensitive file activity. It’s also great for uncovering stealthy network backdoors since it can trace raw TCP/UDP connections. Plus, it can enforce runtime policies in real time, so you can block suspicious behavior before it causes damage.
When I first started using Tetragon it honestly blew my mind. I wonder if we will move away from firewalls and towards a Cilium/Tetragon super stack 🤔
Tetragon exposes its insights via JSON logs and a gRPC endpoint. For this demo, we will use container insights to wrap the JSON logs and ingest them into Microsoft Sentinel.
You can optionally install the Tetragon CLI to help debug and test your policies. Once you’ve applied your Tetragon policies, the logs will be captured, so this is optional.
To test your policies, you can grab all the logs from the export-stdout container from the Tetragon pods, and pipe them into the tetra CLI.
1
kubectl logs -n kube-system -l app.kubernetes.io/name=Tetragon -c export-stdout -f | tetra getevents -o compact --pod store-admin
As shown in the video demonstration, the logs are processed instantly and you can clearly see the behaviour of your policy.
AKS Monitoring
Container Insights
Azure Container Insights is a monitoring solution that gives you visibility into the performance and health of your Kubernetes clusters and containers. It collects metrics, logs, and events and is integrated with Azure Monitor.
There are two methods for getting your logs : creating a Data Collection Rule in Azure or via a ConfigMap within the cluster.
Container insights now logs to the
ContainerLogV2table which has a much better schema (for querying), superseding the oldContainerLogtable.
With Cilium and Tetragon, we are potentially going to get a lot of logs coming through. One way to cut this down is to implement namespace filtering. Unfortunately, you cannot configure namespace filtering with the DCR approach for log ingestion for ContainerLogvV2. So if you want namespace filtering, you’re pretty much forced to use the ConfigMap approach.
It’s also worth knowing, that by default container logs are excluded from the kube-system namespace. As I’ve deployed Cilium/Tetragon in that namespace, i’m having to force collection via the ConfigMap.
Essentially, the DCR is pretty simple to setup and manage, but the ConfigMap gives you so much more useful granularity for getting your logs. There is a decent post from Microsoft about it.
Rolf Schutten’s blog says:
ContainerLogV2 offers an enhanced experience, as it can be configured both through the ConfigMap and DCR (Data Collection Rule). When both are enabled the ContainerLogV2 setting of the ConfigMap will take precedence.
What may also help your decision, is that creating the DCR with terraform just dosent seem to work properly.
Regardless, I’ve deployed both in the example code, you can you play around with it yourself.
Container Insights will deploy the Azure Monitor agent in your cluster.
Azure Monitor for Containers
The wizard Thomas Stringer (who i seem to reference in nearly all my blogs ♥) has a great (but old) post on logging for AKS.
Previously, you’d install the Operations Management Suite in the cluster, which would create a DaemonSet (omsagent) and a Deployment (omsagent-rs) and send the output to your workspace.
Container Insights has largely superceeded this functionality.
Microsoft Sentinel
The official Azure Sentinel (Microsoft Sentinel) Github repo dosent really have any KQL quries for the
ContainerLogorKubePodInventorytables, which makes me think that this space is pretty immature.
Particularly for Cilium and Tetragon, there really isn’t much out there for “these standard security things you should monitor” and here are the corresponding KQL queries / analytic rules for Microsoft Sentinel. Thats definitely an area I want to explore further. But for now, I’ve got a policy for Cilium to enable logging, and a policy for Tetragon for monitoring some specific files like/etc/shadow.
With this deployment, you’ll start to see kube logs trickling through into three relevant tables:
| Table name | Log example |
|---|---|
| ContainerLogV2 | stdout/std err streams from containers |
| KubeEvents | Cluster/nod/pod level events (e.g. resource changes) |
| KubePodInventory | Pod inventory, including lifecycle/status |
In the code and demo, you’ll see I’ve created an analytic rule matching this query:
1
2
3
4
5
6
7
ContainerLogV2
| where ContainerName == "export-stdout"
| extend Process=parse_json(LogMessage).process_exit.process
| extend Workload=Process.pod.workload
| where Process.arguments contains "/etc/shadow"
| extend Binary=Process.binary, Arguments=Process.arguments
| project-away Process
It’s a super specific search and not that practical and alerts on any call where /etc/shadow is passed as an argument. I’ve set the rule up to run every five minutes. Again, this whole piece is just showing off the tech – i’m just you’ll have your own ideas about what you could use it for.
Demonstration
Check out the video here and the reference IaC here.
For this demonstration, I’ve opted to deploy the AKS petstore demo. You can see from the following output, that kube-proxy is not present, that the Azure Monitor Agent (ama) is pretty happy and that Cilium, Hubble, Envoy and Tetragon are all successfully deployed (albiet in the kube-system namespace).
1
2
3
4
5
6
7
8
9
10
11
12
13
14
15
16
17
18
19
20
21
22
23
24
25
26
27
28
29
30
31
32
33
34
35
36
37
38
39
40
41
42
43
44
45
46
47
48
49
50
51
52
53
54
55
56
57
58
59
60
61
62
63
64
65
$ kubectl get pods --all-namespaces
NAMESPACE     NAME                                            READY   STATUS    RESTARTS       AGE
kube-system   ama-logs-2pnj5                                  3/3     Running   0              144m
kube-system   ama-logs-5hhj6                                  3/3     Running   0              144m
kube-system   ama-logs-g6wpv                                  3/3     Running   0              144m
kube-system   ama-logs-rs-59647f4ddb-kjstm                    2/2     Running   0              144m
kube-system   ama-logs-z8mk6                                  3/3     Running   0              144m
kube-system   ama-metrics-5797ddddc8-d29cq                    2/2     Running   0              98m
kube-system   ama-metrics-5797ddddc8-glgc5                    2/2     Running   0              98m
kube-system   ama-metrics-ksm-8fbf76b85-lcnqc                 1/1     Running   0              98m
kube-system   ama-metrics-node-2fzxs                          2/2     Running   0              98m
kube-system   ama-metrics-node-cjqpj                          2/2     Running   0              98m
kube-system   ama-metrics-node-g2df9                          2/2     Running   0              98m
kube-system   ama-metrics-node-lnsdl                          2/2     Running   0              98m
kube-system   ama-metrics-operator-targets-68fc7758ff-sxhz5   2/2     Running   2 (98m ago)    98m
kube-system   Cilium-envoy-2jbvz                              1/1     Running   0              144m
kube-system   Cilium-envoy-5wpxx                              1/1     Running   0              144m
kube-system   Cilium-envoy-8f8dr                              1/1     Running   0              144m
kube-system   Cilium-envoy-92q46                              1/1     Running   0              144m
kube-system   Cilium-ghl78                                    1/1     Running   0              144m
kube-system   Cilium-node-init-62wvg                          1/1     Running   0              144m
kube-system   Cilium-node-init-9zm4g                          1/1     Running   0              144m
kube-system   Cilium-node-init-hmt47                          1/1     Running   0              144m
kube-system   Cilium-node-init-jgpvf                          1/1     Running   0              144m
kube-system   Cilium-npfq4                                    1/1     Running   0              144m
kube-system   Cilium-operator-54bc9947f4-klcvm                1/1     Running   0              144m
kube-system   Cilium-operator-54bc9947f4-pl8g5                1/1     Running   0              144m
kube-system   Cilium-t7bdc                                    1/1     Running   0              144m
kube-system   Cilium-zxdcc                                    1/1     Running   0              144m
kube-system   cloud-node-manager-45hrd                        1/1     Running   0              146m
kube-system   cloud-node-manager-5xzln                        1/1     Running   0              146m
kube-system   cloud-node-manager-84fst                        1/1     Running   0              165m
kube-system   cloud-node-manager-kqq9v                        1/1     Running   0              165m
kube-system   coredns-57d886c994-5ssm8                        1/1     Running   0              143m
kube-system   coredns-57d886c994-l7d5r                        1/1     Running   0              166m
kube-system   coredns-autoscaler-55bcd876cc-2vjqg             1/1     Running   0              166m
kube-system   csi-azuredisk-node-tzs7h                        3/3     Running   0              165m
kube-system   csi-azuredisk-node-xwr6g                        3/3     Running   0              146m
kube-system   csi-azuredisk-node-z44md                        3/3     Running   0              165m
kube-system   csi-azuredisk-node-ztcpj                        3/3     Running   0              146m
kube-system   hubble-relay-8676777f99-4jmmn                   1/1     Running   0              144m
kube-system   hubble-ui-6ffbd75f67-2v8gh                      2/2     Running   0              144m
kube-system   konnectivity-agent-647bc44846-k62q8             1/1     Running   0              142m
kube-system   konnectivity-agent-647bc44846-npv5l             1/1     Running   0              142m
kube-system   konnectivity-agent-autoscaler-679b77b4f-g5vmk   1/1     Running   0              166m
kube-system   metrics-server-545888cb79-mzhkw                 2/2     Running   0              140m
kube-system   metrics-server-545888cb79-t7vzd                 2/2     Running   0              140m
kube-system   retina-agent-cghgq                              1/1     Running   0              97m
kube-system   retina-agent-k8hc6                              1/1     Running   0              97m
kube-system   retina-agent-l8j7z                              1/1     Running   0              97m
kube-system   retina-agent-s2lf8                              1/1     Running   0              97m
kube-system   Tetragon-4vfl9                                  2/2     Running   0              144m
kube-system   Tetragon-9jrnq                                  2/2     Running   0              144m
kube-system   Tetragon-bbkjp                                  2/2     Running   0              144m
kube-system   Tetragon-m7q5z                                  2/2     Running   0              144m
kube-system   Tetragon-operator-7fddfd8fb7-vfs9b              1/1     Running   0              144m
pets          makeline-service-586bb769df-jbq6m               1/1     Running   5 (140m ago)   143m
pets          mongodb-0                                       1/1     Running   0              143m
pets          order-service-74fbc46ddd-klqpz                  1/1     Running   0              143m
pets          product-service-65c7fc7bf-rfrtf                 1/1     Running   0              143m
pets          rabbitmq-0                                      1/1     Running   0              143m
pets          store-admin-5ffdcccd6c-gkb99                    1/1     Running   0              143m
pets          store-front-66ccf8d74d-lshhd                    1/1     Running   0              143m
pets          virtual-customer-7dbb957677-dzcjl               1/1     Running   0              143m
pets          virtual-worker-796f69dcfc-6nm7n                 1/1     Running   0              143m
I deploy a basic Cilium network policy to enable capturing of some network traffic:
1
2
3
4
5
6
7
8
9
10
11
12
13
14
15
16
17
18
19
20
21
22
23
24
25
26
27
28
29
30
apiVersion: Cilium.io/v2
kind: CiliumNetworkPolicy
metadata:
  name: http-ingress-visibility
  namespace: pets
spec:
  endpointSelector:
    matchLabels: {}
  ingress:
    - fromEntities:
        - all
    - toPorts:
        - ports:
            - port: "80"
              protocol: "TCP"
            - port: "8080"
              protocol: "TCP"
            - port: "8081"
              protocol: "TCP"
            - port: "3000"
              protocol: "TCP"
            - port: "3002"
              protocol: "TCP"
            - port: "30669"
              protocol: "TCP"
            - port: "30598"
              protocol: "TCP"
          rules:
            http:
              - {}
As well as a Tetragon security policy for basic file monitoring:
1
2
3
4
5
6
7
8
9
10
11
12
13
14
15
16
17
18
19
20
21
22
23
24
25
26
27
28
29
30
31
32
33
34
35
36
37
38
39
40
41
42
43
44
45
46
47
48
49
50
51
52
53
54
55
56
57
58
59
60
61
62
63
64
65
66
67
68
69
70
71
72
73
74
75
76
77
78
79
80
81
82
83
84
85
86
87
88
89
90
91
92
93
94
95
96
97
98
99
100
101
102
103
104
105
106
107
108
109
110
111
112
113
114
115
116
117
118
119
120
121
122
123
124
125
126
127
128
129
130
131
132
133
134
135
136
137
138
139
140
141
142
143
144
145
146
147
148
149
150
151
152
153
154
155
156
157
158
159
160
161
162
163
164
165
166
167
168
169
170
171
172
173
174
175
176
apiVersion: Cilium.io/v1alpha1
kind: TracingPolicy
metadata:
  name: "file-monitoring-filtered"
spec:
  kprobes:
  - call: "security_file_permission"
    syscall: false
    return: true
    args:
    - index: 0
      type: "file"
    - index: 1
      type: "int"
    returnArg:
      index: 0
      type: "int"
    returnArgAction: "Post"
    selectors:
    - matchArgs:
      - index: 0
        operator: "Prefix"
        values:
        - "/boot"
        - "/root/.ssh"
        - "/etc/shadow"
        - "/etc/profile"
        - "/etc/sudoers"
        - "/etc/pam.conf"
        - "/etc/bashrc"
        - "/etc/csh.cshrc"
        - "/etc/csh.login"
      - index: 1
        operator: "Equal"
        values:
        - "4"
    - matchArgs:
      - index: 0
        operator: "Postfix"
        values:
        - ".bashrc"
        - ".bash_profile"
        - ".bash_login"
        - ".bash_logout"
        - ".cshrc"
        - ".cshdirs"
        - ".profile"
        - ".login"
        - ".logout"
        - ".history"
      - index: 1
        operator: "Equal"
        values:
        - "4"
    - matchArgs:
      - index: 0
        operator: "Prefix"
        values:
        - "/etc"
        - "/boot"
        - "/lib"
        - "/lib64"
        - "/bin"
        - "/usr/lib"
        - "/usr/local/lib"
        - "/usr/local/sbin"
        - "/usr/local/bin"
        - "/usr/bin"
        - "/usr/sbin"
        - "/var/log"
        - "/dev/log"
        - "/root/.ssh"
      - index: 1
        operator: "Equal"
        values:
        - "2"
  - call: "security_mmap_file"
    syscall: false
    return: true
    args:
    - index: 0
      type: "file"
    - index: 1
      type: "uint32"
    - index: 2
      type: "uint32"
    returnArg:
      index: 0
      type: "int"
    returnArgAction: "Post"
    selectors:
    - matchArgs:
      - index: 0
        operator: "Prefix"
        values:
        - "/boot"
        - "/root/.ssh"
        - "/etc/shadow"
        - "/etc/sudoers"
        - "/etc/pam.conf"
        - "/etc/profile"
        - "/etc/bashrc"
        - "/etc/csh.cshrc"
        - "/etc/csh.login"
        - ".bashrc"
        - ".bash_profile"
        - ".bash_login"
        - ".bash_logout"
        - ".cshrc"
        - ".cshdirs"
        - ".profile"
        - ".login"
        - ".logout"
        - ".history"
      - index: 1
        operator: "Equal"
        values:
        - "1"
      - index: 2
        operator: "Mask"
        values:
        - "1"
    - matchArgs:
      - index: 0
        operator: "Prefix"
        values:
        - "/etc"
        - "/boot"
        - "/lib"
        - "/lib64"
        - "/bin"
        - "/usr/lib"
        - "/usr/local/lib"
        - "/usr/local/sbin"
        - "/usr/local/bin"
        - "/usr/bin"
        - "/usr/sbin"
        - "/var/log"
        - "/dev/log"
        - "/root/.ssh"
      - index: 1
        operator: "Mask"
        values:
        - "2"
      - index: 2
        operator: "Mask"
        values:
        - "1"
  - call: "security_path_truncate"
    syscall: false
    return: true
    args:
    - index: 0
      type: "path"
    returnArg:
      index: 0
      type: "int"
    returnArgAction: "Post"
    selectors:
    - matchArgs:
      - index: 0
        operator: "Prefix"
        values:
        - "/etc"
        - "/boot"
        - "/lib"
        - "/lib64"
        - "/usr/lib"
        - "/usr/local/lib"
        - "/usr/local/sbin"
        - "/usr/local/bin"
        - "/usr/bin"
        - "/usr/sbin"
        - "/var/log"
        - "/dev/log"
        - "/root/.ssh"
I exec into the store-admin container, glossing over any initial access. I then just run cat /etc/shadow, which will be picked up by Tetragon, and forwarded onto Microsoft Sentinel via Azure container insights.
In Microsoft Sentinel, I’ve hacked together a very basic query that will match that log:
1
2
3
4
5
6
7
ContainerLogV2
| where ContainerName == "export-stdout"
| extend Process=parse_json(LogMessage).process_exit.process
| extend Workload=Process.pod.workload
| where Process.arguments contains "/etc/shadow"
| extend Binary=Process.binary, Arguments=Process.arguments
| project-away Process
Using that query, I’ve created an analytics rule which will create an incident. 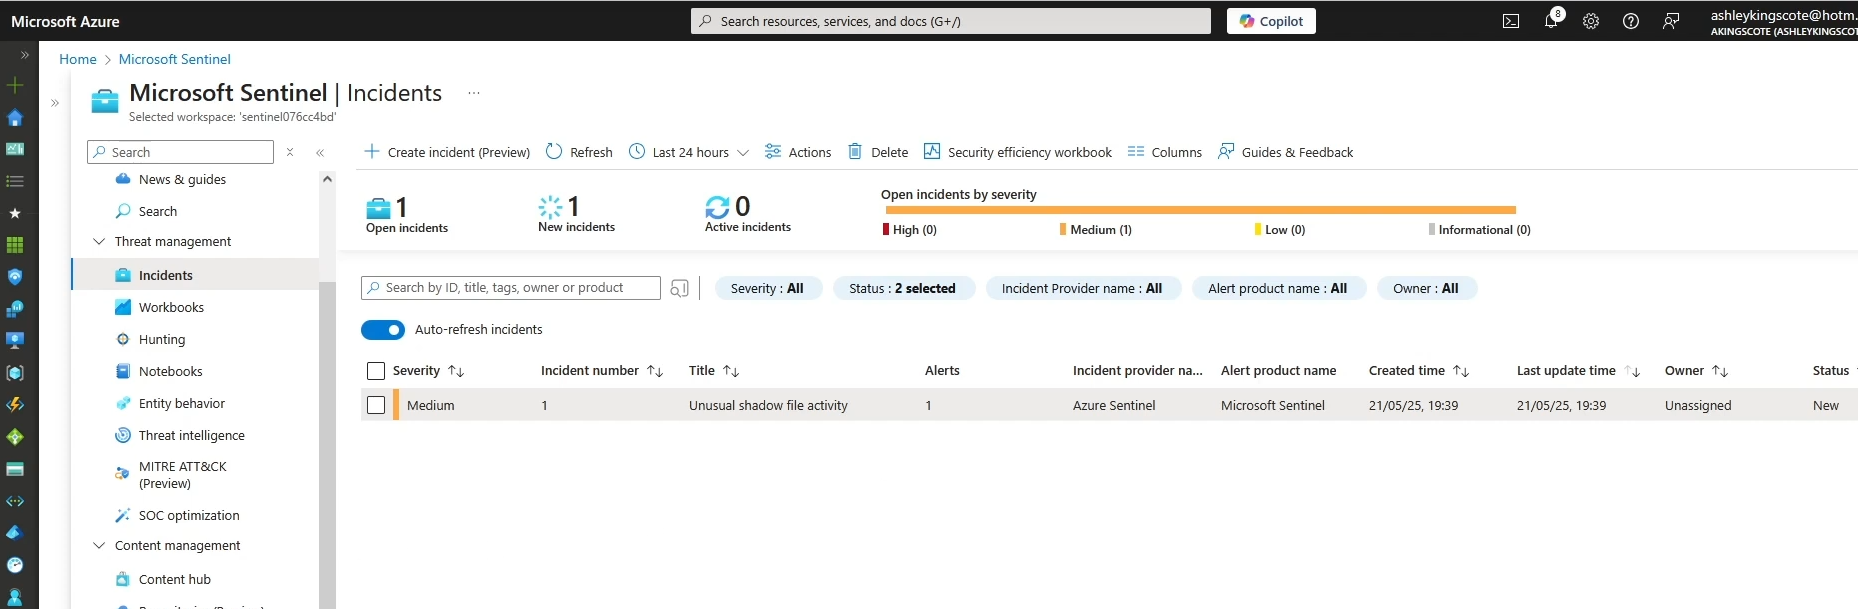
I also demonstrate a Tetragon policy with Sigkill in place, killing the process immediately which also logs the activity.
1
2
3
4
5
6
7
8
9
10
11
12
13
14
15
16
17
18
19
20
21
22
23
24
25
26
27
28
29
30
31
32
33
34
35
...
 kprobes:
  - call: "security_file_permission"
    syscall: false
    return: true
    args:
    - index: 0
      type: "file"
    - index: 1
      type: "int"
    returnArg:
      index: 0
      type: "int"
    returnArgAction: "Post"
    selectors:
    - matchArgs:
      - index: 0
        operator: "Prefix"
        values:
        - "/boot"
        - "/root/.ssh"
        - "/etc/shadow"
        - "/etc/profile"
        - "/etc/sudoers"
        - "/etc/pam.conf"
        - "/etc/bashrc"
        - "/etc/csh.cshrc"
        - "/etc/csh.login"
      - index: 1
        operator: "Equal"
        values:
        - "4"
      matchActions:
      - action: Sigkill
...
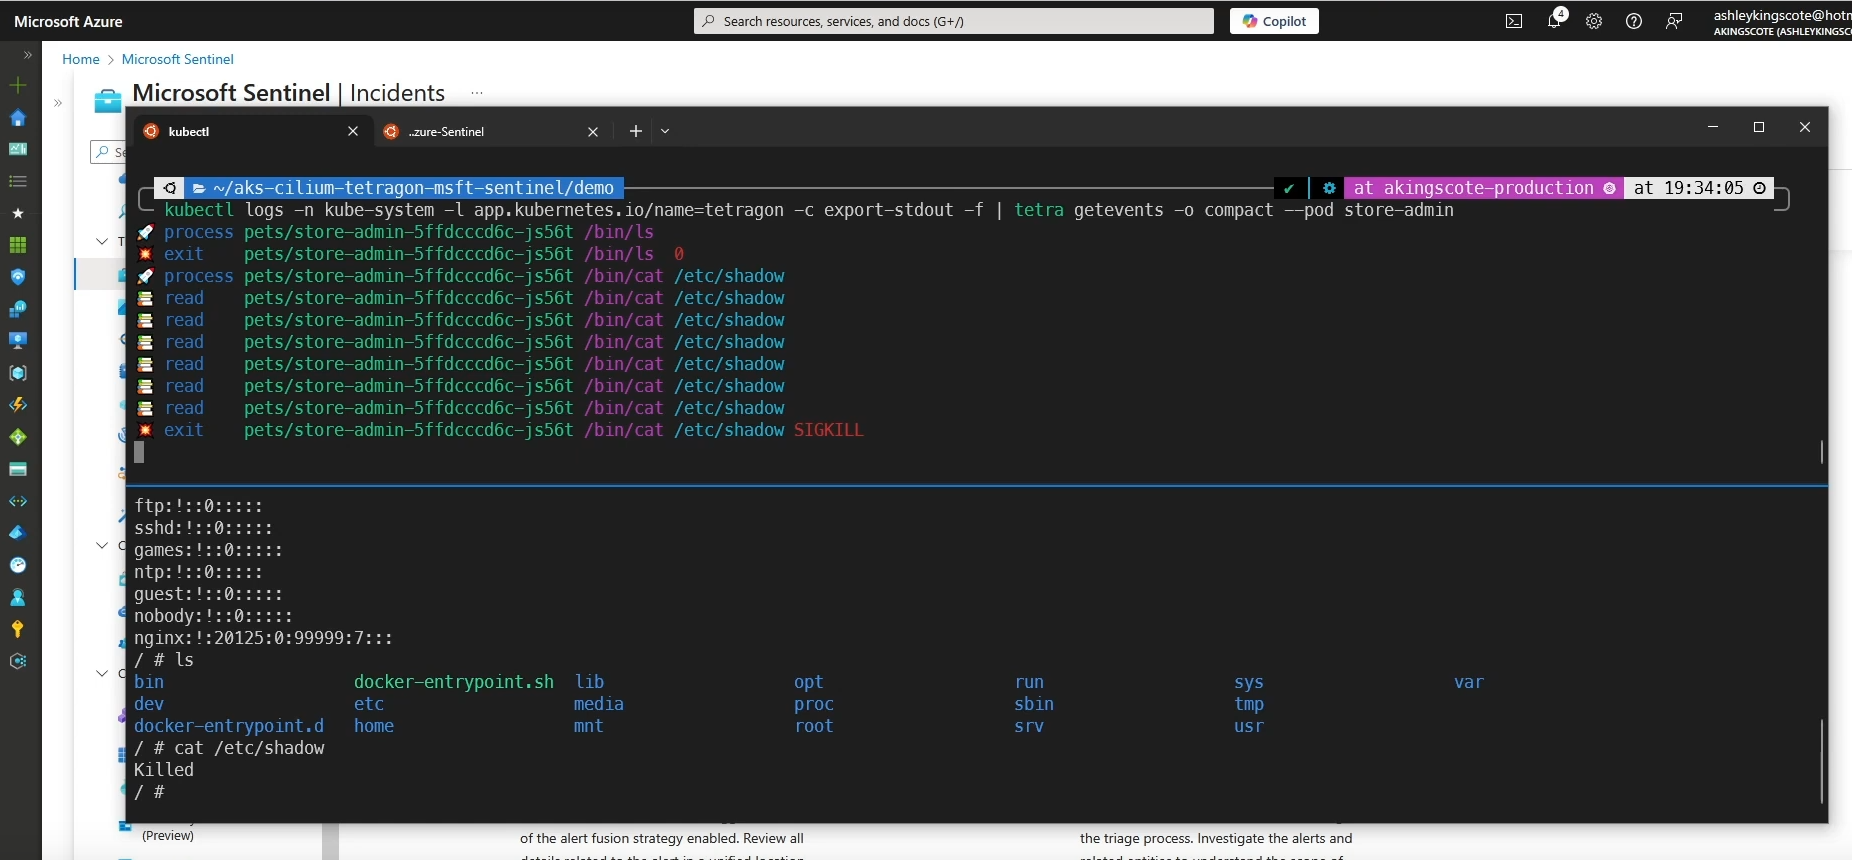
The (grainy) screenshot above shows that the cat /etc/shadow was instantly killed. By itself thats pretty cool, but coupled with the fact its eBPF based, easy to manage, and integrated into Microsoft Sentinel makes the whole concept shine.
Conclusion: Unlocking Next-Gen Kubernetes Security with eBPF and Microsoft Sentinel
The intention of this work was to:
- Figure out how to integrate all this tech
- Highlight the potential for this tech stack
- Provide a reference for others
This integration of Cilium, Tetragon, and Microsoft Sentinel demonstrates how modern eBPF-powered tooling can transform Kubernetes security—without relying on expensive enterprise licenses. Replacing “legacy” systems like kube-proxy with Cilium’s eBPF dataplane, enforcing runtime security with Tetragon, and feeding real-time detections into Microsoft Sentinel, creates a high-performance observability and threat detection stack that’s both powerful and practical.
Key Takeaways
- ✅ Cilium’s eBPF magic – Faster networking (+ bypassing iptables bottlenecks), L7 visibility, and policy enforcement.
- ✅ Tetragon’s runtime superpowers – Detecting sensitive file access to killing malicious processes
- ✅ Microsoft Sentinel as the brains – Correlate Tetragon alerts with other logs, automate responses, and turn kernel-level signals into SOC incidents.
Next up, I might take a look at detecting real-world attacks (like container escapes or crypto miners) with Tetragon + Microsoft Sentinel, or explore the world of eBPF for Windows 👀
I hope you’ve enjoyed this post, and it’s sparked some ideas of how you could apply it within your own organization.