Ubuntu Server - Grafana & MySQL with Python System Monitor Daemon
A Python script collects basic CPU percentage utilisation data and and stores the information in a MySQL database. The database is hosted on a Ubuntu Server on a virtual machine. The Python script is installed as a Linux Standard Base (LSB) service and is started automatically on system startup after the MySQL service has completed. Grafana is installed on the server as a data visualisation tool. So basically its a self monitoring sever with a pretty frontend.
This post covers the following areas:
- MySQL & Python Installation & Setup
- Service Installation & Setup
- Grafana Installation & Setup
The purpose is to show these various technologies integrated together to show an example of how to setup the components. The Python script is basic and not particularly accurate but it used to show a basic data collection mechanism.
Ubuntu Server
Using VMWare Workstation 14, i downloaded Ubuntu Server 16.04.4 LTS and created a basic virtual machine. I changed the networking in VMWare to bridged and ensured i could ping the virtual machine from the host. Once the basic setup is completed, i performed the following:
Update
sudo apt-get update
Install MySQL Server - make sure you remember the user credentials that you make at this stage
sudo apt-get install mysql-server
Install Python version 3 and Pip
sudo apt-get install python3-pip
Upgrade Pip
python3 -m pip install --upgrade pip
Install psutil - the python library used to gather some system data
python3 -m pip install psutil
Install pymysql - the python library used to connect to the MySQL Database
python3 -m pip install pymysql
Install Policykit 1 - used for creating the service
sudo apt-get install policykit-1
If you are on Windows and are having trouble getting the psutil library to work (vcvarstall.bat error), you should make sure you have Microsoft Visual C++ Compiler installed and can then try the following steps:
1
2
3
python3 -m pip install -U pip
python3 -m pip pip install -U setuptools
python3 -m pip install -U virtualenv
Its worth restarting the server and checking that the MySQL server is installed properly and starts on system boot.
sudo shutdown -r now
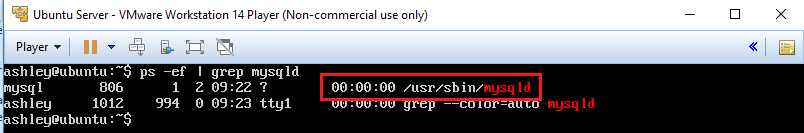
When its booted back up, use the ps command to check the processes, you can grep the results to search for MySQL to save you having to wade through the results
ps -ef | grep mysqld
MySQL Setup
After installing mysql-server and checking that the service is running, we can log into it using the credentials entered during installation.
mysql -u root -p
You can then enter your password. Now we need to create a database, switch to it, then create a table with a couple of fields. Im using an auto-incremented integer field as the primary key and creating an integer field called “Percentage” which will hold the CPU percentage value. There will also be a timestamp field so that the data can be timeseries.
1
2
3
4
5
6
7
8
9
10
mysql -u root -p
create database system_info;
show databases;
use system_info;
create table cpu_percentage (ID int NOT NULL AUTO_INCREMENT,
Percentage int,
Timestamp datetime,
PRIMARY KEY (ID));
show tables;
exit;
If you need to alter the table once you have created it, you can do it like this:
1
2
ALTER TABLE cpu_percentage MODIFY COLUMN ID INT NOT NULL AUTO_INCREMENT;
ALTER TABLE cpu_percentage MODIFY COLUMN Timestamp timestamp;
Finally create a MySQL user account that Grafana will use. As Grafana cant guarntee that the queries itll be using are 100%, we are going to assign the account read only permissions on the database and table.
1
2
CREATE USER 'grafanaReader' IDENTIFIED BY 'akingscote';
GRANT SELECT ON system_info.cpu_percentage TO 'grafanaReader';
Python Script
This is just a basic script that uses the psutil package and the pymysql package to gather CPU utilisation percentages every two seconds and add them to the database. You can see that my database password isnt the best, but thats not the point of the post.
You can create the file using the nano editor. Press CTRL and ‘X’ and then press Y and enter.
sudo nano psutil_daemon.py
1
2
3
4
5
6
7
8
9
10
11
12
13
14
15
16
17
18
from datetime import datetime
from time import sleep
import psutil
import pymysql.cursors

connection = pymysql.connect(host="localhost", user="root", password="ashley", db="system_info", charset="utf8mb4", cursorclass=pymysql.cursors.DictCursor)

try:
    with connection.cursor() as cursor:
        while True:
            sql = "INSERT INTO cpu_percentage (Percentage, Timestamp) VALUES ({}, '{}')".format(psutil.cpu_percent(interval=1), datetime.now())
            cursor.execute(sql)
            #commit changes to stable storage
            connection.commit()

            sleep(2)
except:
    connection.close()
Once created, ensure you can run the script and it works. Make it executable
sudo chmod +x psutil_daemon.py
Then run it
python3 psutil_daemon.py
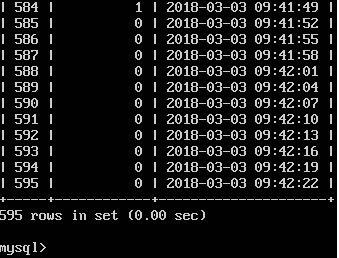
You can check that data has gone into the database by logging into MySQL, selecting the database and then querying the table.
1
2
3
4
5
mysql -u root -p
show databases;
use system_info;
show tables;
select * from cpu_percentage;
Python Script - Service
Next, we are going to create a bash script that simply calls the Python script. This bash script will be installed as a service which will automatically be started on system boot. We can set service dependencies and make one of them MySQL as we dont want to try and insert data into the database if MySQL isnt even running yet. This process is incredibly useful but the information on how to do it is quite hard to find.
Previously, you had to change the the run control levels within /etc/rc* and create symbolic links to the scripts. The more modern approach is to use Linux Standard Base (LSB) to simplify this process. Firstly, create a script within /etc/init.d.
sudo nano /etc/init.d/psutil_service
The script should look something like this:
1
2
3
4
5
6
7
8
9
10
11
#!/bin/sh
### BEGIN INIT INFO
# Provides: psutil_service
# Required-Start: $syslog $network $local_fs $remote_fs mysql
# Required-Stop: $syslog $network $local_fs $remote_fs mysql
# Default-Start: 2 3 4 5
# Default-Stop: 0 1 6
# Short Description: Runs the psutil_daemon.py script
# Description: Runs the psutil_daemon.py script which adds data to a mysql db.
### END INIT INFO
su -c "python3 /home/ashley/psutil_daemon.py" ashley
The most important part is the INIT INFO. The provides section declares the service name. The required start are the services that must be started before this service is started. Notice how mysql doesnt have a $ prefix, this is because the $syslog $network $local_fs $remote_fs reference more than one service which is defined elsewhere. The default-start/stop refer to the various run levels. So 2,3,4,5 are standard run levels for user applications, 0,1,6 are not used for user applications and are used by the system.
The section that actually calls the script is:
su -c "python3 /home/ashley/psutil_daemon.py" ashley
When using pip to install a Python package, pip installs it only for that user. If you installed the packages using root, then you can just use
sudo python3 /home/ashley/psutil_daemon.py
But as i installed the packages as user “ashley”, I have to use the su -c command. The full command is wrapped in quotes to turn the command into a string. Otherwise the service will try and execute “python3” and not the whole command.
Finally, make sure the service is executable and then update the run control levels. Passing any arguments to the program are now redundant and the priorities are defined in the actual script itself.
1
2
3
cd /etc/init.d
sudo chmod +x psutil_service defaults
sudo update-rc.d psutil_service defaults
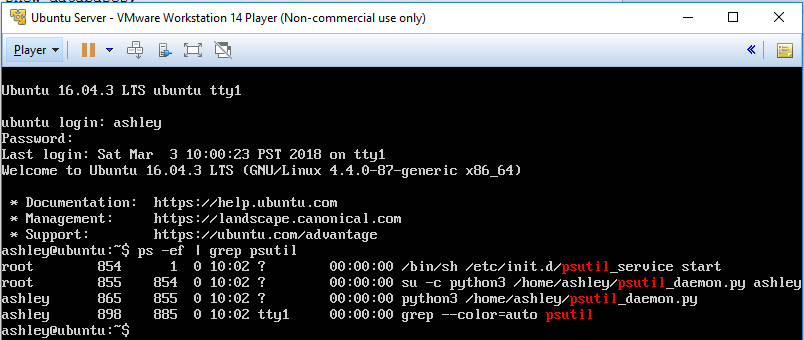
Next, restart the server and check that the service has been started by default.
ps -ef | grep psutil
Grafana
Now that we have a service that runs on boot which automatically updates the database, we are ready to install the grafana tool.
On the server, download and install Grafana
1
2
wget https://s3-us-west-2.amazonaws.com/grafana-releases/release/grafana_5.0.0_amd64.deb
sudo dpkg -i grafana_5.0.0_amd64.deb
Set grafana to automatically start
1
2
sudo systemctl daemon-reload
sudo systemctl enable grafana-server
Check the configuration files
sudo nano /etc/grafana/grafana.ini
The configuration shows that grafana listens on localhost at port 3000. Ensuring i can ping my VM from my windows host, i can access the Grafana UI on my VM’s IP address at port 3000.
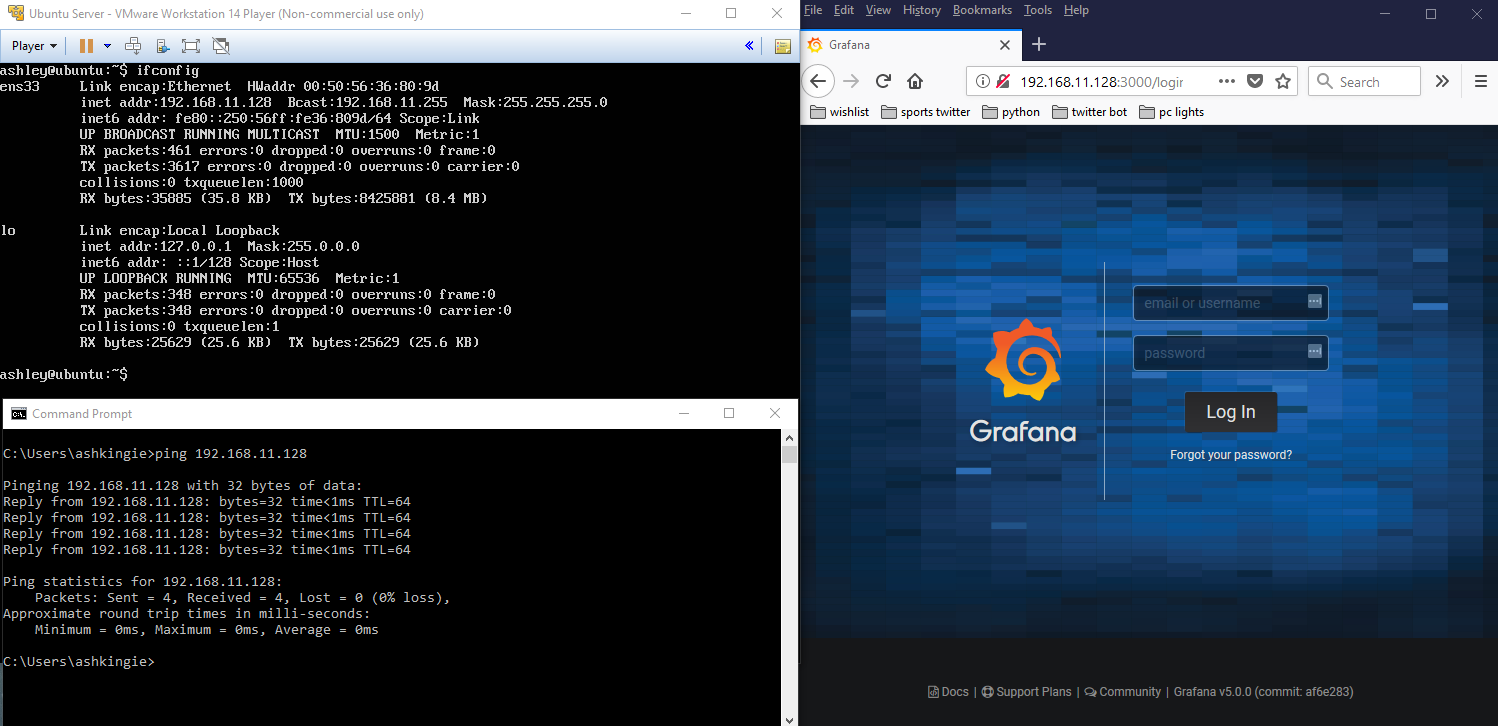
The top left of the above image shows my IP configuration of the Ubuntu Server VM (switched to a host only interface in VMWare network settings). The bottom left shows a successful ping from my Windows host to the ens33 interface of the Ubuntu Server. The right side of the image shows that I can access the Grafana UI on my Windows host, by entering the servers IP address and going to port 3000.
You will be able to log into Grafana using the default username/password of admin/admin.
Once you have logged in, you can then add a data source. Select MySQL. 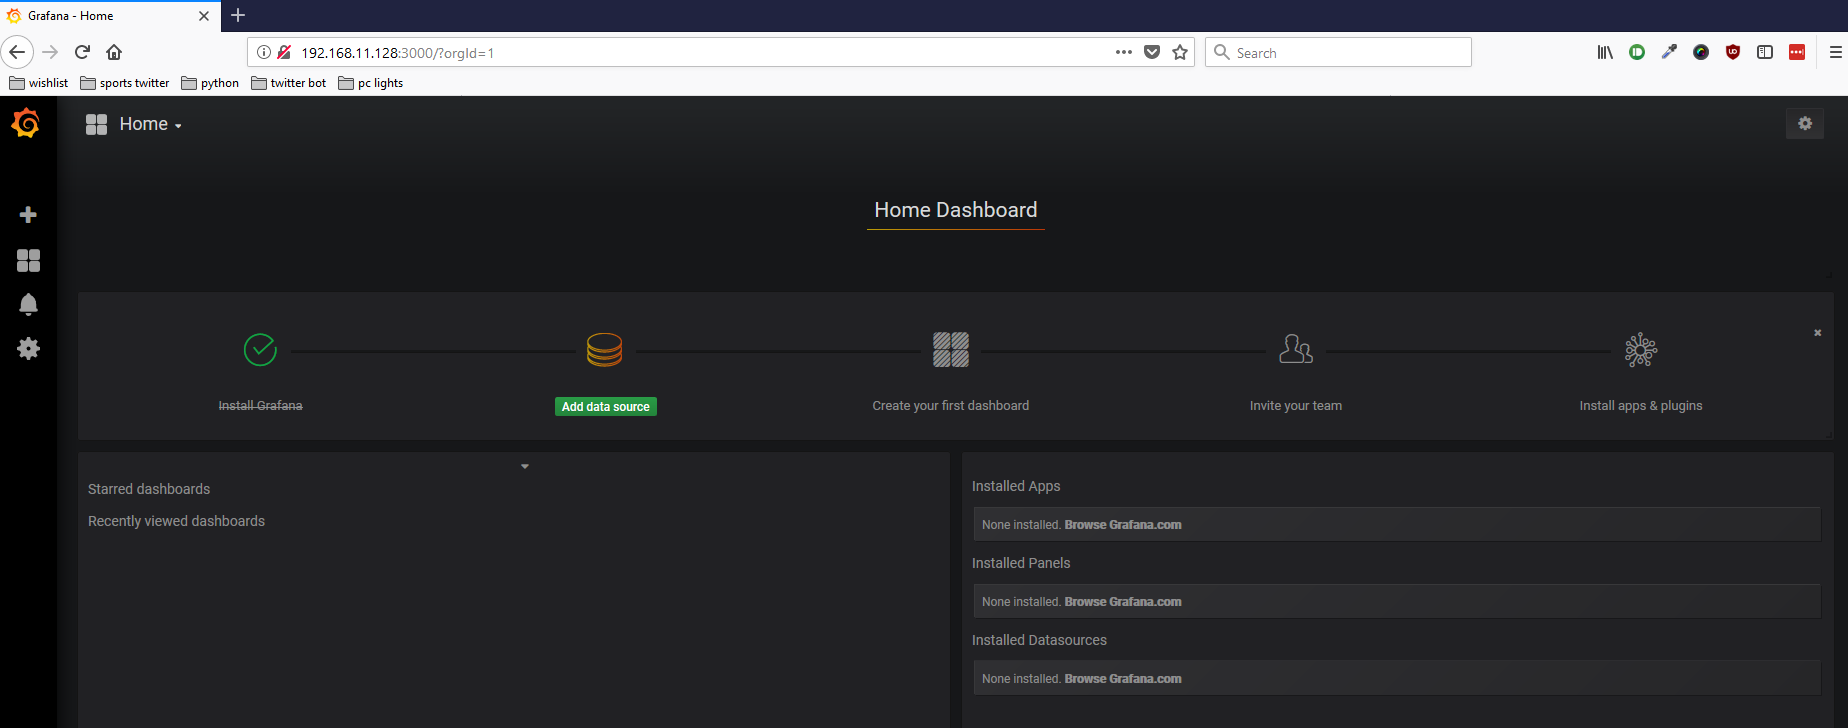
Select the Database and ensure you use the read-only MySQL account created earlier. 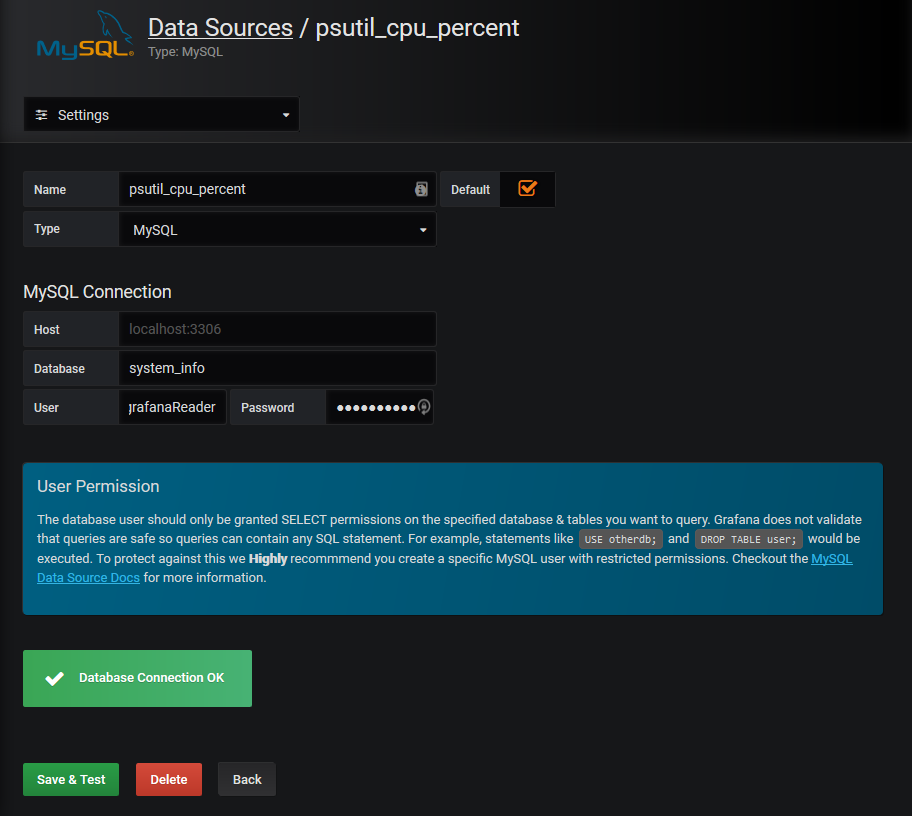
Create a new dashboard using the + arrow on the left navigation menu. Select bar graph and then click the dropdown on panel title. 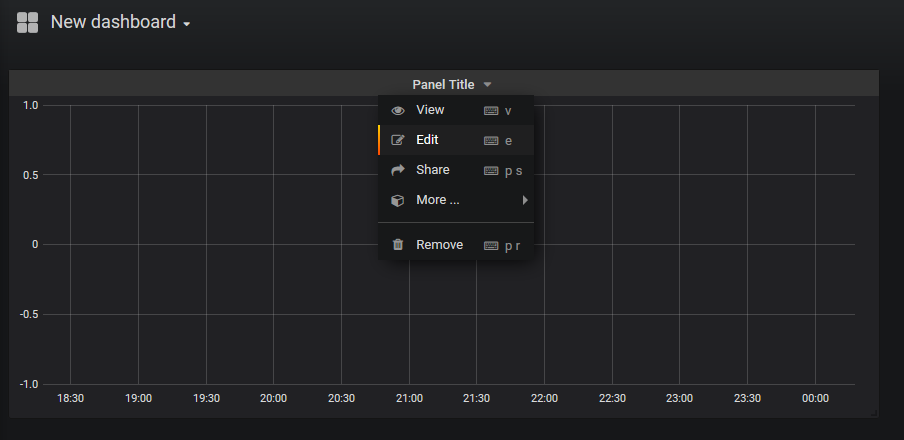
Next, change the Data Source option under the Metrics tab to the source added previously. Update the SQL Query to the following:
1
2
3
4
5
6
SELECT
  UNIX_TIMESTAMP(Timestamp) as time_sec,
  Percentage as value
FROM cpu_percentage
WHERE $__timeFilter(Timestamp)
ORDER BY time_sec ASC
Finally save then change the settings of the dashboard to show recent data and update at least every 5 seconds. 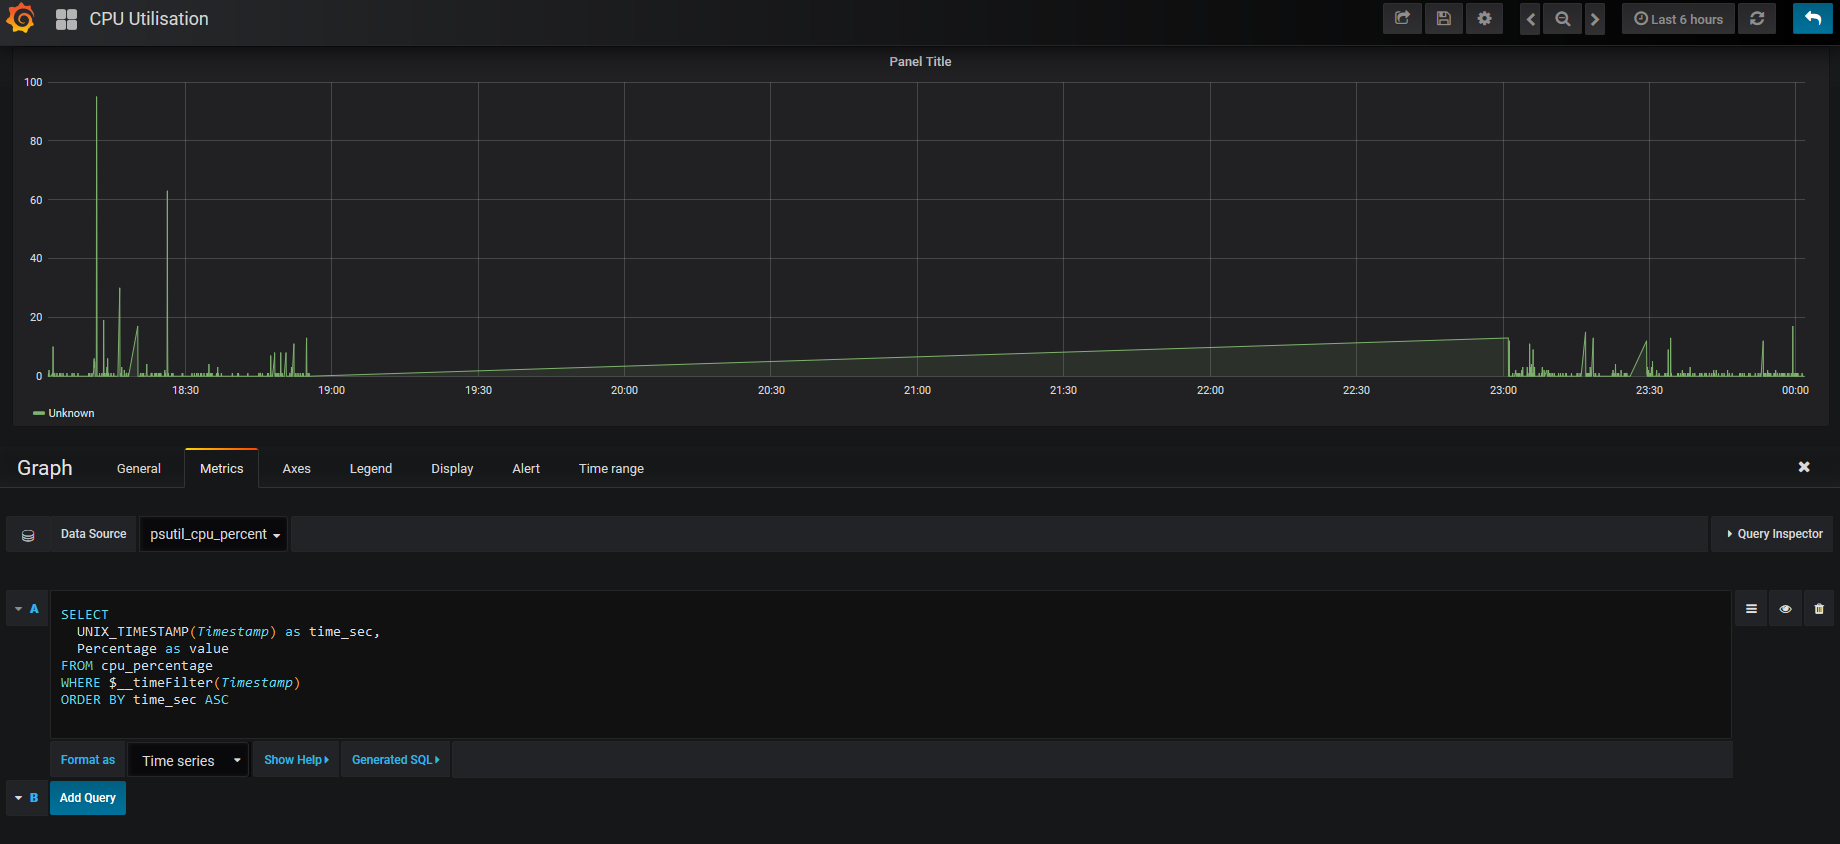
When you return to the home page, you can resize the graph and you should end up with something like this: